File:Shale gas production USA.svg
跳转到导航
跳转到搜索

此SVG文件的PNG预览的大小:800 × 417像素。 其他分辨率:320 × 167像素 | 640 × 334像素 | 1,024 × 534像素 | 1,280 × 668像素 | 2,560 × 1,336像素。
原始文件 (SVG文件,尺寸为1,150 × 600像素,文件大小:78 KB)
说明
说明
添加一行文字以描述该文件所表现的内容
摘要
[编辑]
| 描述 |
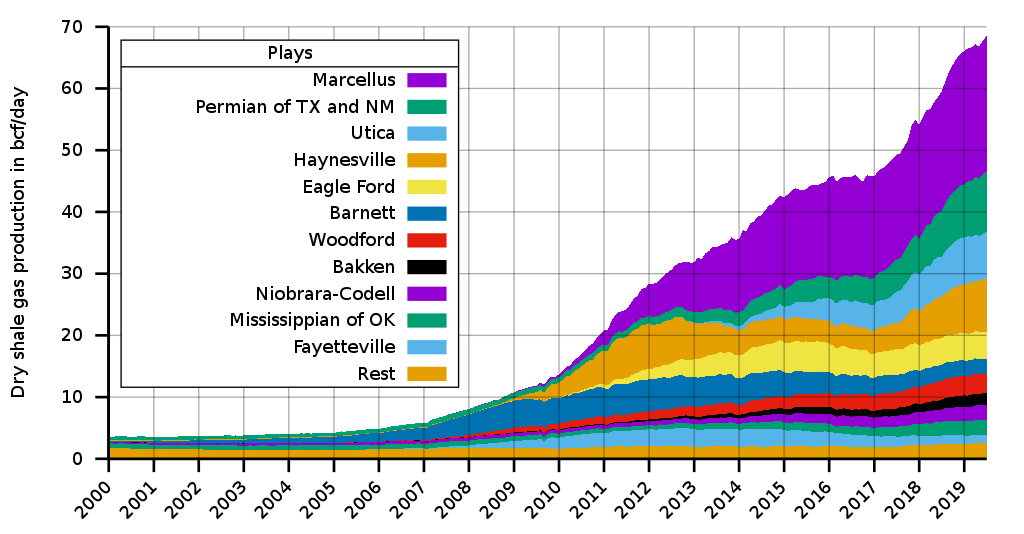
English: Natural gas production from US shale plays as estimated by the U.S. Energy Information Administration (EIA) |
| 日期 | (creation date of original version) |
| 来源 |
自己的作品 Data source: excel sheet from EIA (as of July 2019), retrieved via EIA Natural Gas Weekly Update Data source of original version is available at archive.org |
| 作者 |
Original version: Kopiersperre Updated version as of July 2019: Gretarsson |
| SVG开发 | |
| 源代码 | Gnuplot codereset
set terminal svg size 1150,600 font "DejaVu Sans,20"
set key top left box lw 1.5 samplen 2 title 'Plays'
set border 3 linewidth 3
set grid lt 1 lw 1.5 lc rgb 0xAA090909 front
set xdata time
set timefmt '%Y-%m-%d'
set format x '%Y'
set ylabel 'Dry shale gas production in bcf/day'
set tics nomirror out
set xtics 60*60*24*365.25 rotate by 45 right
unset mxtics
set autoscale xfix
set yrange [0:]
set datafile separator ";"
set output 'Shale gas production USA.svg'
plot \
for [i=2:13] \
'data.csv' using 1:(sum [col=i:13] column(col)) \
title columnheader(i) \
with filledcurves x1
unset output
|
许可协议
[编辑]
我,本作品著作权人,特此采用以下许可协议发表本作品:
本文件采用知识共享署名-相同方式共享 4.0 国际许可协议授权。
- 您可以自由地:
- 共享 – 复制、发行并传播本作品
- 修改 – 改编作品
- 惟须遵守下列条件:
- 署名 – 您必须对作品进行署名,提供授权条款的链接,并说明是否对原始内容进行了更改。您可以用任何合理的方式来署名,但不得以任何方式表明许可人认可您或您的使用。
- 相同方式共享 – 如果您再混合、转换或者基于本作品进行创作,您必须以与原先许可协议相同或相兼容的许可协议分发您贡献的作品。
文件历史
点击某个日期/时间查看对应时刻的文件。
| 日期/时间 | 缩略图 | 大小 | 用户 | 备注 | |
|---|---|---|---|---|---|
| 当前 | 2019年9月24日 (二) 20:27 | | 1,150 × 600(78 KB) | Gretarsson(留言 | 贡献) | "Declared character encoding" altered to UTF-8 in order to make file valid again according to W3C markup validation |
| 2019年8月20日 (二) 15:45 |  | 1,150 × 600(78 KB) | Gretarsson(留言 | 贡献) | It’s probably better to consequently use the same play names as in the source data. I have researched which formations could be included in ‘Permian (TX, NM)’ and ‘Mississippian (OK)’ but I’m not sure whether this is the Wolfcamp Shale and the Caney, Springer, and Goddard Fms, respectively. A play map of the EIA (https://www.eia.gov/maps/images/shale_gas_lower48.jpg) cites only the Abo, Yeso, Bone Springs, and Spraberry Fms for the Permian Basin (even though there is mention of shale gas prod... | |
| 2019年8月19日 (一) 23:41 |  | 1,150 × 600(78 KB) | Gretarsson(留言 | 贡献) | closer in style to the original one | |
| 2019年8月19日 (一) 23:11 |  | 1,150 × 600(78 KB) | Gretarsson(留言 | 贡献) | updated as per July 2019 | |
| 2016年10月18日 (二) 09:55 |  | 1,000 × 600(90 KB) | Kopiersperre(留言 | 贡献) | fontsize | |
| 2016年10月18日 (二) 09:52 |  | 1,000 × 600(90 KB) | Kopiersperre(留言 | 贡献) | =={{int:filedesc}}== {{Information |description={{en|1=Natural gas production from US shale plays}} |Date={{subst:CURRENTYEAR}}-{{subst:CURRENTMONTH}}-{{subst:CURRENTDAY2}} |source={{own}}<br />[http://www.eia.gov/naturalgas/weekly/img/shale_gas_201608... |
您不可以覆盖此文件。
文件用途
全域文件用途
以下其他wiki使用此文件:
- ar.wikipedia.org上的用途
- de.wikipedia.org上的用途
- en.wikipedia.org上的用途
- zh.wikipedia.org上的用途