File:Sunspot Numbers.png

Algfail (1813 × 762 pikslit, faili suurus: 115 KB, MIME tüüp: image/png)
Pealdised
Pealdised

|
See pilt tuleks konverteerida kasutades vektorgraafikat (SVG-vorming). Vektorkujutisel on mitmeid eeliseid. Konverteerimise kohta vaata täpsemalt siit. Kui sellest pildist on vektorkujutis juba saadaval, siis pane selle malli asemele {{vector version available|uue pildi nimi.svg}}.
|
Lühikirjeldus[muuda]

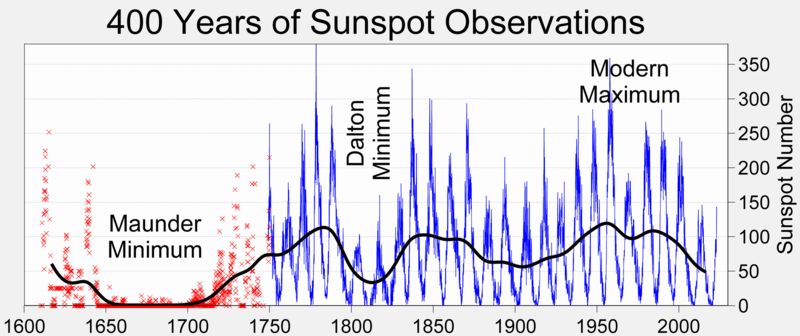
This figure summarizes sunspot number observations. Since c. 1749, continuous monthly averages[dead link] of sunspot activity have been available and are shown here as reported by the Solar Influences Data Analysis Center, World Data Center for the Sunspot Index, at the Royal Observatory of Belgium. These figures are based on an average of measurements from many different observatories around the world. Prior to 1749, sporadic observations of sunspots are available. These were compiled and placed on consistent monthly framework by Hoyt & Schatten (1998a, 1998b).
The most prominent feature of this graph is the c. 11 year solar magnetic cycle which is associated with the natural waxing and waning of solar activity.
On longer time scales, the sun has shown considerable variability, including the long Maunder Minimum when almost no sunspots were observed, the less severe Dalton Minimum, and increased sunspot activity during the last fifty years, known as the Modern Maximum. The causes for these variations are not well understood, but because sunspots and associated faculae affect the brightness of the sun, solar luminosity is lower during periods of low sunspot activity. It is widely believed that the low solar activity during the Maunder Minimum may be among the principal causes of the chilly Little Ice Age, circa 1350-1850 A.D.
Copyright[muuda]
This figure was prepared by Robert A. Rohde and is part of the Global Warming Art project.

|
Luba on antud selle dokumendi kopeerimiseks, avaldamiseks ja/või muutmiseks GNU Vaba Dokumentatsiooni Litsentsi versiooni 1.2 või hilisema Vaba Tarkvara Fondi avaldatud versiooni tingimuste alusel; muutumatute osadeta, esikaane tekstideta ja tagakaane tekstideta. Sellest loast on lisatud koopia leheküljel pealkirjaga "GNU Free Documentation License".http://www.gnu.org/copyleft/fdl.htmlGFDLGNU Free Documentation Licensetruetrue |
| See fail kuulub jurisdiktsiooniga sidumata Creative Commonsi litsentsi "Autorile viitamine + jagamine samadel tingimustel 3.0" alla. | ||
| ||
| See litsentsimärgis lisati sellele failile GFDL-i litsentsimisuuenduse raames.http://creativecommons.org/licenses/by-sa/3.0/CC BY-SA 3.0Creative Commons Attribution-Share Alike 3.0truetrue |
References[muuda]
- Hoyt, D. V., and K. H. Schatten (1998a). "Group sunspot numbers: A new solar activity reconstruction. Part 1.". Solar Physics 179: 189-219.
- Hoyt, D. V., and K. H. Schatten (1998b). "Group sunspot numbers: A new solar activity reconstruction. Part 2.". Solar Physics 181: 491-512.
- Stott, Peter A.; Gareth S. Jones and John F. B. Mitchell (15 December 2003). "Do Models Underestimate the Solar Contribution to Recent Climate Change". Journal of Climate 16: 4079-4093.
Faili ajalugu
Klõpsa kuupäeva ja kellaaega, et näha sel ajahetkel kasutusel olnud failiversiooni.
| Kuupäev/kellaaeg | Pisipilt | Mõõtmed | Kasutaja | Kommentaar | |
|---|---|---|---|---|---|
| viimane | 1. veebruar 2023, kell 13:44 |  | 1813 × 762 (115 KB) | Dragons flight (arutelu | kaastöö) | Update time series to January 2023 |
| 24. august 2022, kell 11:37 |  | 1813 × 762 (115 KB) | Dragons flight (arutelu | kaastöö) | Update time series to present | |
| 23. november 2015, kell 15:21 |  | 1020 × 425 (78 KB) | NCdave (arutelu | kaastöö) | I added another decade to the graph (through Oct., 2015). I started with the previous version was uploaded in 2006. Because it was almost a decade old, it lacked Solar Cycle 24. So I started with that version, and pasted a properly-scaled version of h... | |
| 23. november 2015, kell 15:18 |  | 1000 × 425 (42 KB) | NCdave (arutelu | kaastöö) | Reverted to version as of 20:16, 20 July 2006 (UTC) | |
| 23. november 2015, kell 15:15 |  | 1020 × 425 (78 KB) | NCdave (arutelu | kaastöö) | I added another decade to the graph (through Oct., 2015). I started with the previous version was uploaded in 2006. Because it was almost a decade old, it lacked Solar Cycle 24. So I started with that version, and pasted a properly-scaled version of h... | |
| 20. juuli 2006, kell 20:16 |  | 1000 × 425 (42 KB) | Nils Simon (arutelu | kaastöö) |
Sa ei saa seda faili üle kirjutada.
Faili kasutus
Seda faili kasutavad järgmised 8 lehekülge:
Globaalne failikasutus
Järgmised muud vikid kasutavad seda faili:
- Faili kasutus vikis af.wikipedia.org
- Faili kasutus vikis ar.wikipedia.org
- Faili kasutus vikis az.wikipedia.org
- Faili kasutus vikis be.wikipedia.org
- Faili kasutus vikis bg.wikipedia.org
- Faili kasutus vikis ca.wikipedia.org
- Faili kasutus vikis cs.wikipedia.org
- Faili kasutus vikis da.wikipedia.org
- Faili kasutus vikis de.wikipedia.org
- Faili kasutus vikis de.wikiversity.org
- Faili kasutus vikis el.wikipedia.org
- Faili kasutus vikis en.wikipedia.org
- Faili kasutus vikis en.wikiversity.org
- Faili kasutus vikis es.wikipedia.org
- Faili kasutus vikis et.wikipedia.org
- Faili kasutus vikis fa.wikipedia.org
- Faili kasutus vikis fi.wikipedia.org
- Faili kasutus vikis fr.wikipedia.org
Vaata selle faili globaalset kasutust.
Metaandmed
See fail sisaldab lisateavet, mille on tõenäoliselt lisanud digikaamera või skanner.
Kui faili on rakendustarkvaraga töödeldud, võib osa andmeid olla muudetud või täielikult eemaldatud.
| Faili muutmise kuupäev ja kellaaeg | 1. veebruar 2023, kell 13:42 |
|---|