File:Temperature-relative humidity chart - PMV method.png
跳转到导航
跳转到搜索

本预览的尺寸:707 × 599像素。 其他分辨率:283 × 240像素 | 566 × 480像素 | 906 × 768像素 | 1,246 × 1,056像素。
原始文件 (1,246 × 1,056像素,文件大小:114 KB,MIME类型:image/png)
说明
说明
添加一行文字以描述该文件所表现的内容
摘要
[编辑]
| 描述 |
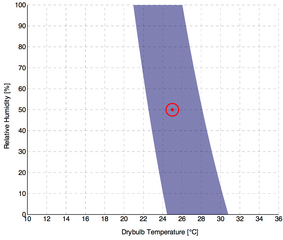
English: This chart represents the acceptable combination of air temperature and humidity values, according to the PMV/PPD method in the ASHRAE 55-2010 Standard. The representation is made on a temperature-relative humidity, instead of a standard psychrometric chart.
The comfort zone in blue represents the 90% of acceptability, which means the conditions between -0.5 and +0.5 PMV, or PPD < 10%. |
| 日期 | |
| 来源 | CBE Thermal Comfort Tool for ASHRAE 55 (cbe.berkeley.edu/comforttool) |
| 作者 | Center for the Built Environment, University of California Berkeley |
许可协议
[编辑]
本文件采用知识共享署名-相同方式共享 3.0 未本地化版本许可协议授权。
署名: Center for the Built Environment, University of California Berkeley
- 您可以自由地:
- 共享 – 复制、发行并传播本作品
- 修改 – 改编作品
- 惟须遵守下列条件:
- 署名 – 您必须对作品进行署名,提供授权条款的链接,并说明是否对原始内容进行了更改。您可以用任何合理的方式来署名,但不得以任何方式表明许可人认可您或您的使用。
- 相同方式共享 – 如果您再混合、转换或者基于本作品进行创作,您必须以与原先许可协议相同或相兼容的许可协议分发您贡献的作品。
文件历史
点击某个日期/时间查看对应时刻的文件。
| 日期/时间 | 缩略图 | 大小 | 用户 | 备注 | |
|---|---|---|---|---|---|
| 当前 | 2017年3月5日 (日) 15:22 | | 1,246 × 1,056(114 KB) | Ras67(留言 | 贡献) | =={{int:filedesc}}== {{Information |description={{en|1=This chart represents the acceptable combination of air temperature and humidity values, according to the PMV/PPD method in the ASHRAE 55-2010 Standard. The representation is made on a temperature-... |
您不可以覆盖此文件。
文件用途
全域文件用途
以下其他wiki使用此文件:
- en.wikipedia.org上的用途
- fa.wikipedia.org上的用途
- sk.wikipedia.org上的用途
- zh.wikipedia.org上的用途