File:Temporal variations of forest resilience and its key drivers.webp
跳转到导航
跳转到搜索

此WEBP文件的PNG预览的大小:770 × 600像素。 其他分辨率:308 × 240像素 | 616 × 480像素 | 986 × 768像素 | 1,280 × 997像素 | 2,116 × 1,648像素。
原始文件 (2,116 × 1,648像素,文件大小:302 KB,MIME类型:image/webp)
说明
说明
添加一行文字以描述该文件所表现的内容
From the study "Emerging signals of declining forest resilience under climate change"
摘要
[编辑]
| 描述 |
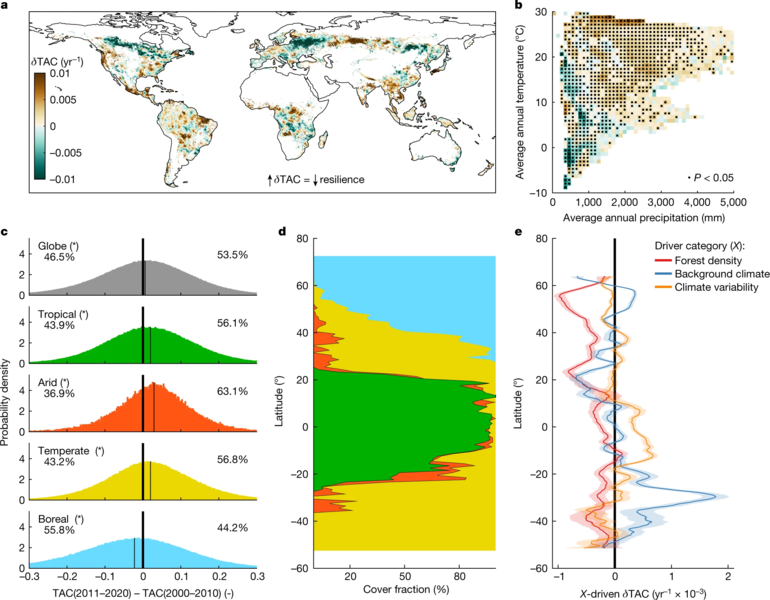
English: "a, Spatial map of the temporal trend of TAC (δTAC). Positive δTAC values (for example, tropical forests) suggest a reduction in recovery rates and thus a decline in resilience, and vice versa for negative δTAC values (for example, boreal forests). The values are averaged over a 1° × 1° moving window for visual purposes. b, δTAC as in a binned as a function of climatological temperature and precipitation. The black dots indicate bins with average values that are statistically different from zero (two-sided Student’s t-test; P value ≤ 0.05). c, Frequency distribution of the differences in TAC computed for two independent temporal windows (2011–2020 minus 2000–2010) and shown separately for different climate regions. The numbers refer to the percentage of the observations lower and greater than zero; the asterisks indicate distributions with averages that are statistically different from zero (two-sided Student’s t-test; P value ≤ 0.05). The thin vertical line in each plot shows the distribution average. d, The cover fraction corresponding to each climate region and colour code reported in c and shown over the latitudinal gradient. e, The zonal average of the trend in TAC (δTAC) as determined by the three drivers (X) at 5° latitudinal resolution and the corresponding 95% confidence interval shown as a coloured line and shaded band, respectively. The colours reflect the three different driver categories: forest density, background climate and climate variability." |
| 日期 | |
| 来源 | https://www.nature.com/articles/s41586-022-04959-9 |
| 作者 | Authors of the study: Giovanni Forzieri, Vasilis Dakos, Nate G. McDowell, Alkama Ramdane & Alessandro Cescatti |
许可协议
[编辑]
文件历史
点击某个日期/时间查看对应时刻的文件。
| 日期/时间 | 缩略图 | 大小 | 用户 | 备注 | |
|---|---|---|---|---|---|
| 当前 | 2022年8月27日 (六) 21:43 | | 2,116 × 1,648(302 KB) | Prototyperspective(留言 | 贡献) | Uploaded a work by Authors of the study: Giovanni Forzieri, Vasilis Dakos, Nate G. McDowell, Alkama Ramdane & Alessandro Cescatti from https://www.nature.com/articles/s41586-022-04959-9 with UploadWizard |
您不可以覆盖此文件。
文件用途
没有页面使用本文件。
全域文件用途
以下其他wiki使用此文件:
- cs.wikipedia.org上的用途
- en.wikipedia.org上的用途
- fa.wikipedia.org上的用途
- ig.wikipedia.org上的用途
- zh.wikipedia.org上的用途