File:Wiggers Diagram.svg

元のファイル (SVG ファイル、1,098 × 841 ピクセル、ファイルサイズ: 36キロバイト)
キャプション
キャプション
概要
[編集]| 解説Wiggers Diagram.svg |
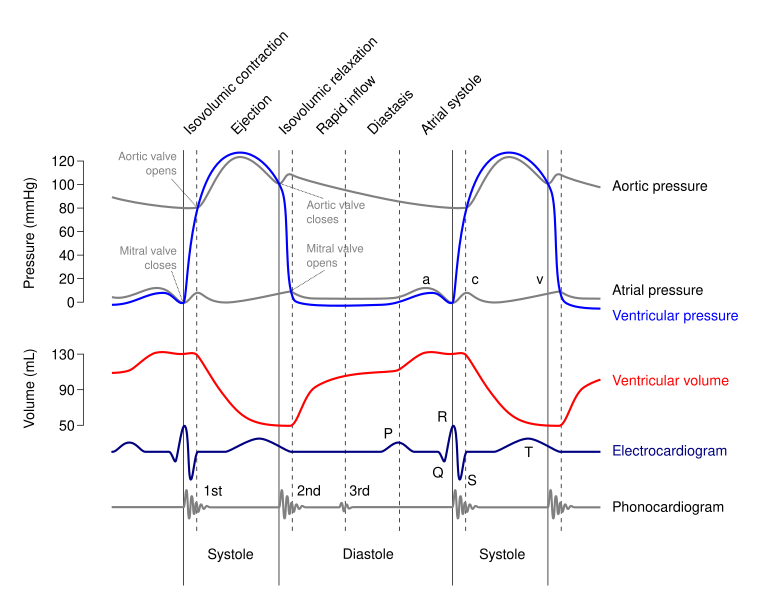
English: A Wiggers diagram, showing the cardiac cycle events occuring in the left ventricle.
In the atrial pressure plot: wave "a" corresponds to atrial contraction, wave "c" corresponds to an increase in pressure from the mitral valve bulging into the atrium after closure, and wave "v" corresponds to passive atrial filling. In the electrocardiogram: wave "P" corresponds to atrial depolarization, waves "QRS" correspond to ventricular depolarization, and wave "T" corresponds to ventricular repolarization. In the phonocardiogram: The sound labeled 1st contributes to the S1 heart sound and is the reverberation of blood from the sudden closure of the mitral valve (left A-V valve) and the sound labeled "2nd" contributes to the S2 heart sound and is the reverberation of blood from the sudden closure of the aortic valve. |
| 日付 | |
| 原典 | Wikimedia Commons, File:Wiggers Diagram.png. |
| 作者 | DanielChangMD revised original work of DestinyQx; Redrawn as SVG by xavax |
| その他のバージョン |
[編集] SVG[編集]
PNG[編集]
|
This a revision on the work by DestinyQx whose original image can be found here: http://commons.wikimedia.org/wiki/File:Cardiac_Cycle_Left_Ventricle.PNG
The original image incorrectly portrays aortic valve closure which occurs when left ventricular pressure falls below aortic pressure. This has been corrected in this png revision. Some spelling has also been corrected. The credit for the original drawing goes to DestinyQx.
Please use this link to translate the drawing.
ライセンス
[編集]- あなたは以下の条件に従う場合に限り、自由に
- 共有 – 本作品を複製、頒布、展示、実演できます。
- 再構成 – 二次的著作物を作成できます。
- あなたの従うべき条件は以下の通りです。
- 表示 – あなたは適切なクレジットを表示し、ライセンスへのリンクを提供し、変更があったらその旨を示さなければなりません。これらは合理的であればどのような方法で行っても構いませんが、許諾者があなたやあなたの利用行為を支持していると示唆するような方法は除きます。
- 継承 – もしあなたがこの作品をリミックスしたり、改変したり、加工した場合には、あなたはあなたの貢献部分を元の作品とこれと同一または互換性があるライセンスの下に頒布しなければなりません。
ファイルの履歴
過去の版のファイルを表示するには、その版の日時をクリックしてください。
| 日付と時刻 | サムネイル | 寸法 | 利用者 | コメント | |
|---|---|---|---|---|---|
| 現在の版 | 2021年8月2日 (月) 03:06 |  | 1,098 × 841 (36キロバイト) | Yerachmiel C (トーク | 投稿記録) | File uploaded using svgtranslate tool (https://svgtranslate.toolforge.org/). Added translation for lv. |
| 2021年8月2日 (月) 03:02 |  | 1,098 × 841 (36キロバイト) | Yerachmiel C (トーク | 投稿記録) | File uploaded using svgtranslate tool (https://svgtranslate.toolforge.org/). Added translation for lv. | |
| 2012年3月21日 (水) 17:56 |  | 1,098 × 841 (21キロバイト) | Xavax (トーク | 投稿記録) | Code reduced | |
| 2012年3月20日 (火) 19:38 |  | 1,053 × 841 (30キロバイト) | Xavax (トーク | 投稿記録) | some corrections: text, colors and positons of text objects | |
| 2012年3月20日 (火) 12:56 |  | 1,053 × 841 (29キロバイト) | Xavax (トーク | 投稿記録) | now 200% | |
| 2012年3月20日 (火) 11:27 |  | 528 × 421 (30キロバイト) | Xavax (トーク | 投稿記録) | =={{int:filedesc}}== {{Information |description={{en|1=A Wiggers diagram, showing the cardiac cycle events occuring in the left ventricle. In the atrial pressure plot: wave "a" corresponds to atrial contraction, wave "c" corresponds to an increase in... | |
| 2012年3月20日 (火) 11:19 |  | 528 × 421 (32キロバイト) | Xavax (トーク | 投稿記録) | =={{int:filedesc}}== {{Information |description={{en|1=A Wiggers diagram, showing the cardiac cycle events occuring in the left ventricle. In the atrial pressure plot: wave "a" corresponds to atrial contraction, wave "c" corresponds to an increase in... | |
| 2012年3月20日 (火) 11:16 |  | 528 × 421 (31キロバイト) | Xavax (トーク | 投稿記録) | =={{int:filedesc}}== {{Information |description={{en|1=A Wiggers diagram, showing the cardiac cycle events occuring in the left ventricle. In the atrial pressure plot: wave "a" corresponds to atrial contraction, wave "c" corresponds to an increase in... | |
| 2012年3月20日 (火) 11:12 |  | 528 × 421 (31キロバイト) | Xavax (トーク | 投稿記録) | =={{int:filedesc}}== {{Information |description={{en|1=A Wiggers diagram, showing the cardiac cycle events occuring in the left ventricle. In the atrial pressure plot: wave "a" corresponds to atrial contraction, wave "c" corresponds to an increase in... | |
| 2012年3月20日 (火) 11:10 |  | 528 × 421 (29キロバイト) | Xavax (トーク | 投稿記録) | =={{int:filedesc}}== {{Information |description={{en|1=A Wiggers diagram, showing the cardiac cycle events occuring in the left ventricle. In the atrial pressure plot: wave "a" corresponds to atrial contraction, wave "c" corresponds to an increase in... |
このファイルは上書きできません。
ファイルの使用状況
以下の 6 ページがこのファイルを使用しています:
グローバルなファイル使用状況
以下に挙げる他のウィキがこの画像を使っています:
- ar.wikipedia.org での使用状況
- bn.wikipedia.org での使用状況
- ca.wikipedia.org での使用状況
- ceb.wikipedia.org での使用状況
- de.wikipedia.org での使用状況
- el.wikipedia.org での使用状況
- en.wikipedia.org での使用状況
- en.wikibooks.org での使用状況
- es.wikipedia.org での使用状況
- fa.wikipedia.org での使用状況
- fr.wikipedia.org での使用状況
- ga.wikipedia.org での使用状況
- ja.wikipedia.org での使用状況
- ko.wikipedia.org での使用状況
- lv.wikipedia.org での使用状況
- ml.wikipedia.org での使用状況
- nl.wikipedia.org での使用状況
- ru.wikipedia.org での使用状況
- sr.wikipedia.org での使用状況
- sv.wikipedia.org での使用状況
- th.wikipedia.org での使用状況
- tr.wikipedia.org での使用状況
- zh.wikipedia.org での使用状況
メタデータ
このファイルには、追加情報があります (おそらく、作成やデジタル化する際に使用したデジタルカメラやスキャナーが追加したものです)。
このファイルが元の状態から変更されている場合、修正されたファイルを完全に反映していない項目がある場合があります。
| 画像の幅 | 1098.4271 |
|---|---|
| 画像の高さ | 840.81598 |


