File:WorldWarII-GDP-Relations-Allies-Axis.png
元のファイル (640 × 630 ピクセル、ファイルサイズ: 20キロバイト、MIME タイプ: image/png)
キャプション
キャプション
概要[編集]
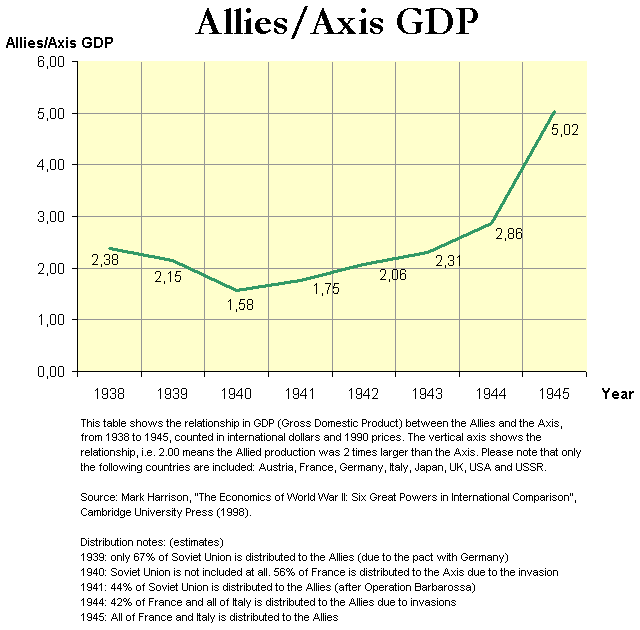
| 解説 | This table shows the relationship in GDP (Gross Domestic Product) between the Allies and the Axis, from 1938 to 1945, counted in international dollars and 1990 prices. The vertical axis shows the relationship, i.e. 2.00 means the Allied production was 2 times larger than the Axis. Please note that only the following countries are included: Austria, France, Germany, Italy, Japan, UK, USA and the Soviet Union. |
| 日付 | |
| 原典 | Mark Harrison, "The Economics of World War II", see more information below |
| 作者 | User:Dna-webmaster |
| 許可 (ファイルの再利用) |
Public domain |
| その他のバージョン |
 |
This table shows the relationship in GDP (Gross Domestic Product) between the Allies and the Axis, from 1938 to 1945, counted in international dollars and 1990 prices. The vertical axis shows the relationship, i.e. 2.00 means the Allied production was 2 times larger than the Axis. Please note that only the following countries are included: Austria, France, Germany, Italy, Japan, UK, USA and the Soviet Union.
Source: Mark Harrison, "The Economics of World War II: Six Great Powers in International Comparison", Cambridge University Press (1998).
Distribution notes: (estimates)
- 1939: only 67% of Soviet Union is distributed to the Allies (due to the pact with Germany)
- 1940: Soviet Union is not included at all. 56% of France is distributed to the Axis due to the invasion
- 1941: 44% of Soviet Union is distributed to the Allies (after Operation Barbarossa)
- 1944: 42% of France and all of Italy is distributed to the Allies due to invasions
- 1945: All of France and Italy is distributed to the Allies
Regards, Dennis Nilsson, Sweden.
If you wish to contact me, please leave a message on my talk page.
ライセンス[編集]
| この著作物の著作権者である私は、この著作物における権利を放棄しパブリックドメインとします。これは全世界で適用されます。 一部の国では、これが法的に可能ではない場合があります。その場合は、次のように宣言します。 私は、あらゆる人に対して、法により必要とされている条件を除き、如何なる条件も課すことなく、あらゆる目的のためにこの著作物を使用する権利を与えます。 |
ファイルの履歴
過去の版のファイルを表示するには、その版の日時をクリックしてください。
| 日付と時刻 | サムネイル | 寸法 | 利用者 | コメント | |
|---|---|---|---|---|---|
| 現在の版 | 2005年12月21日 (水) 05:28 | | 640 × 630 (20キロバイト) | Dna-webmaster~commonswiki (トーク | 投稿記録) | This table shows the relationship in GDP (Gross Domestic Product) between the Allies and the Axis, from 1938 to 1945, counted in international dollars and 1990 prices. The vertical axis shows the relationship, i.e. 2.00 means the Allied production was 2 t |
このファイルは上書きできません。
ファイルの使用状況
このファイルを使用しているページはありません。
グローバルなファイル使用状況
以下に挙げる他のウィキがこの画像を使っています:
- be-tarask.wikipedia.org での使用状況
- cs.wikipedia.org での使用状況
- en.wikipedia.org での使用状況
- hy.wikipedia.org での使用状況
- ja.wikipedia.org での使用状況
- ru.wikipedia.org での使用状況
- uk.wikipedia.org での使用状況
- vi.wikipedia.org での使用状況