File talk:Europe sunshine hours map.png
Source data
[编辑]
The countries' own national data? Gathered and provided by whom? From what time frame? ~ Nelg (talk) 11:28, 5 March 2013 (UTC)
- I have the same question. -- RobLa (talk) 01:02, 2 January 2014 (UTC)
Needs update
[编辑]
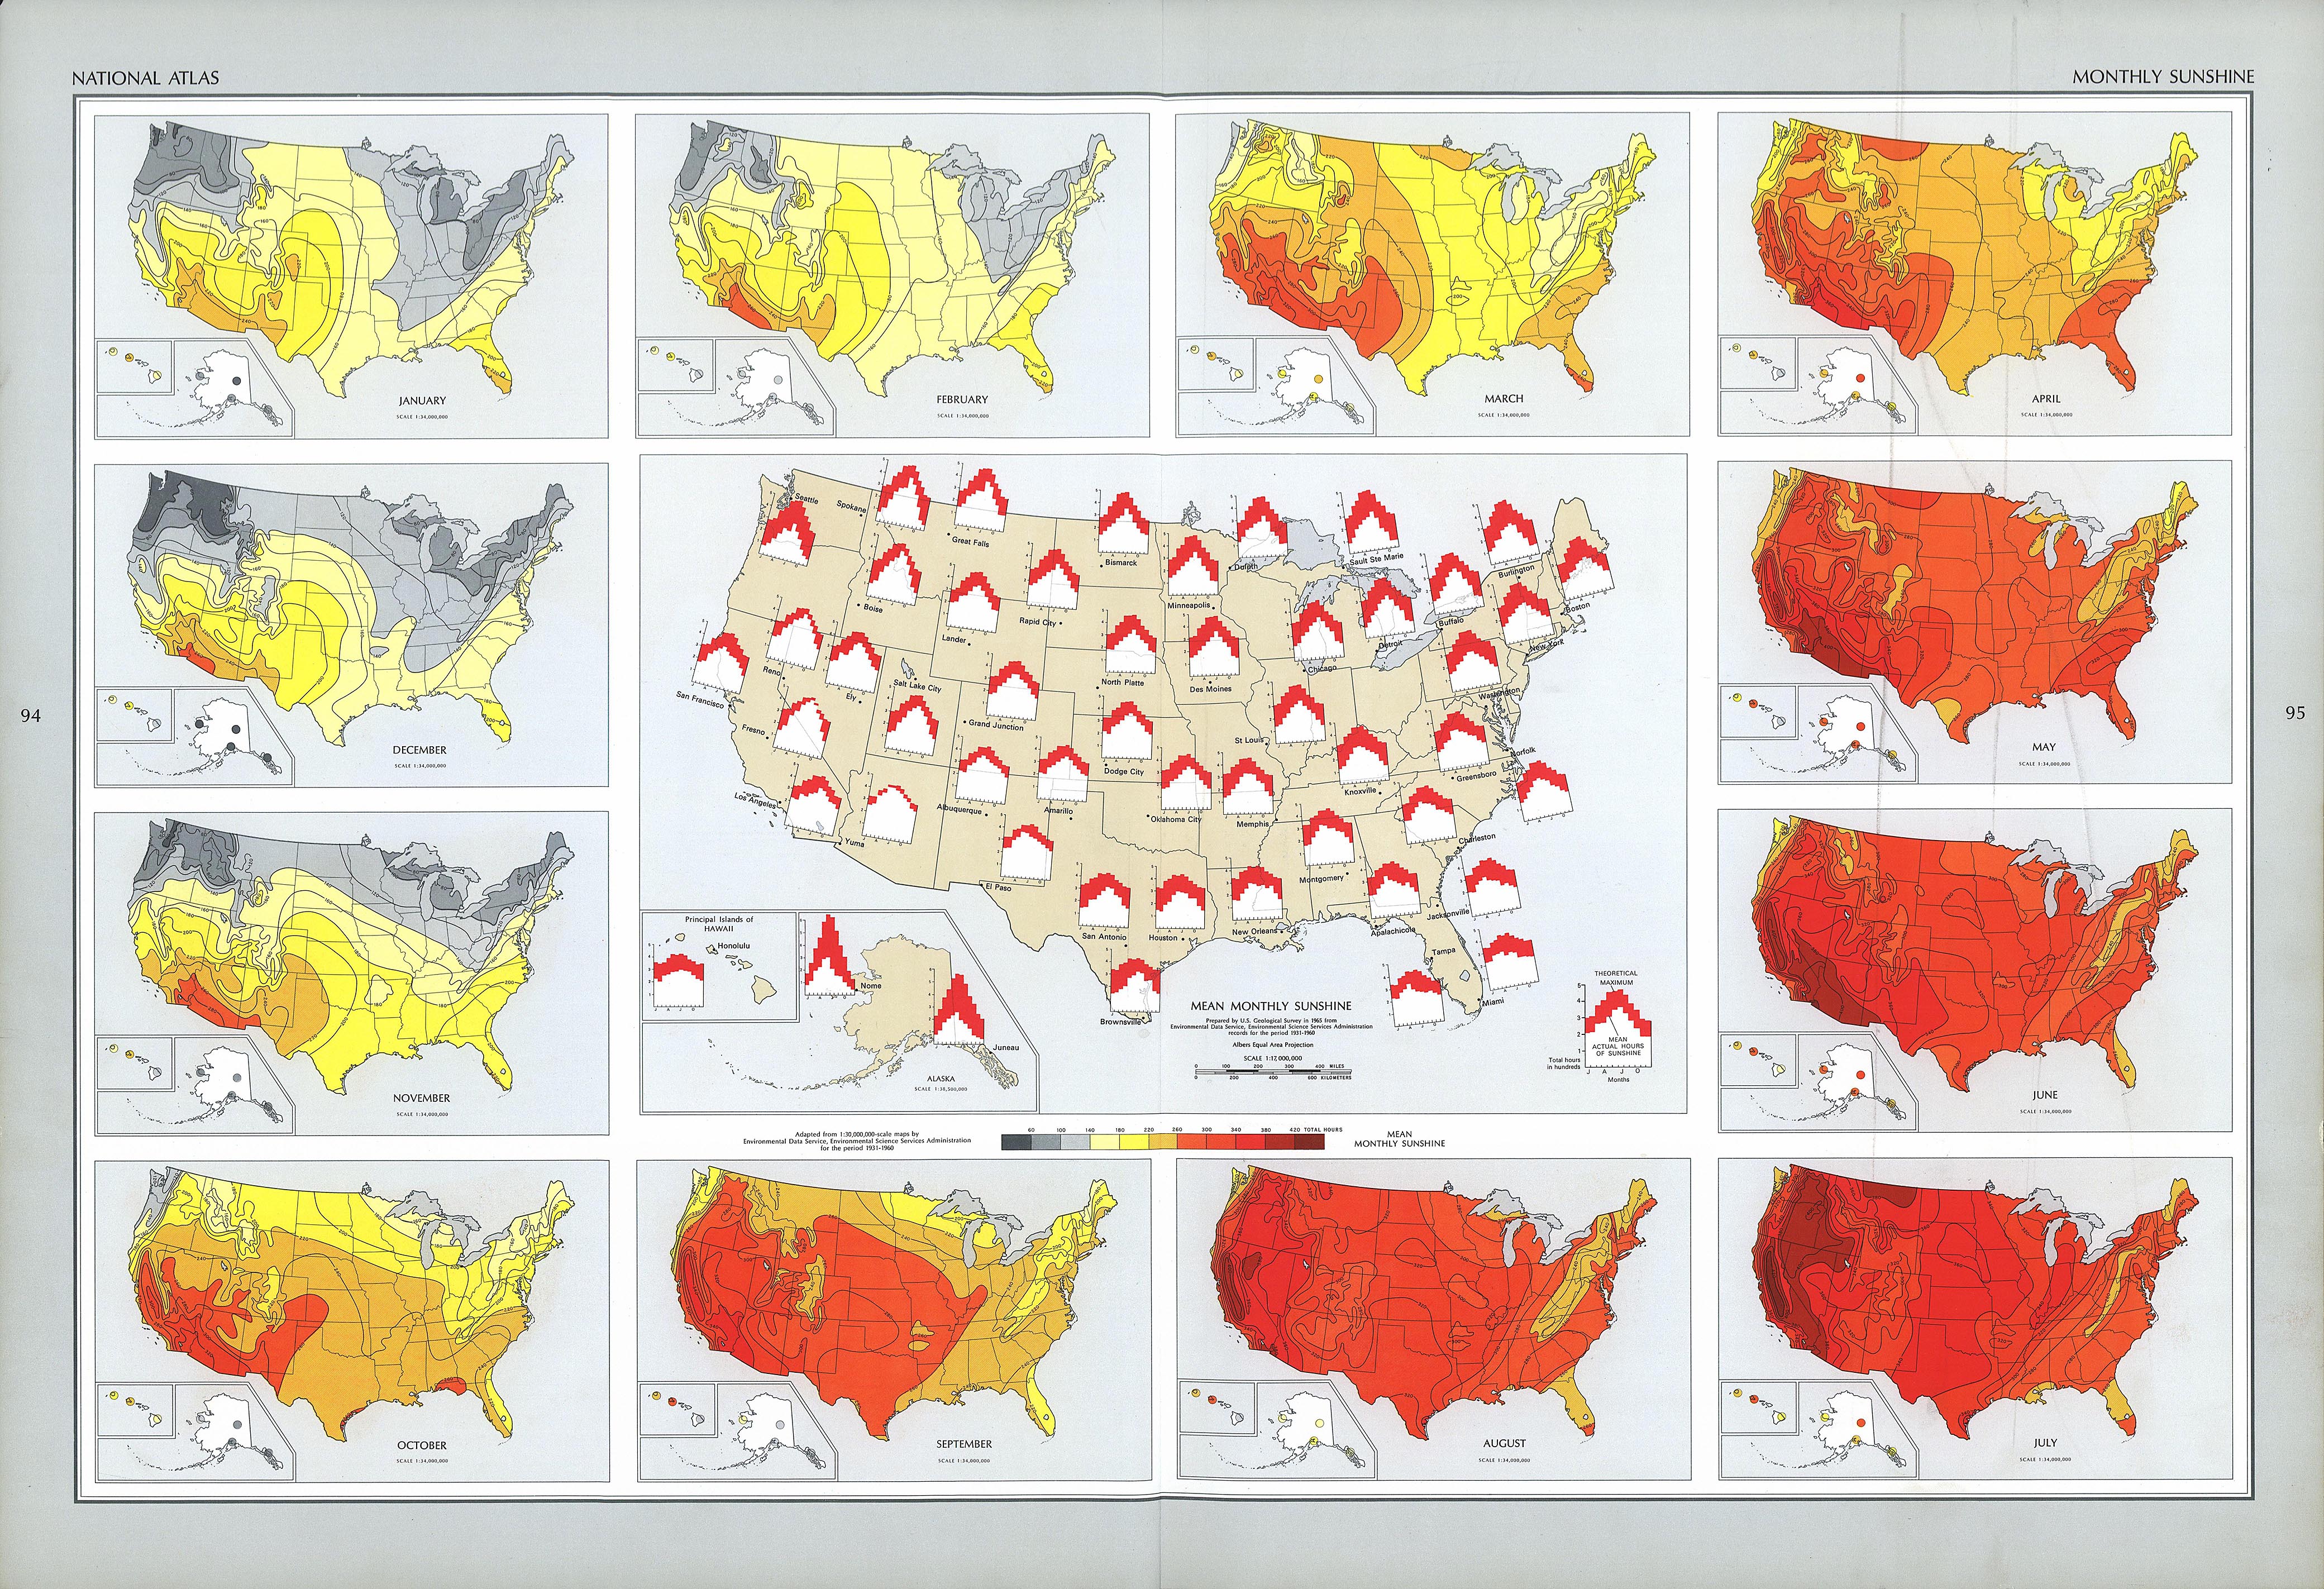
Could someone please update this sunshine duration map? It feels like a very gross estimation since there are only 6 zones. On a national level, more detailed maps have been made. For the U.S., very detailed maps such as the one on http://www.lib.utexas.edu/maps/national_atlas_1970/ca000072.jpg has been made. Even individual months can be analyzed. In europe this is fragmented since no single weather service that I've found has data for all of Europe but hopefully I might have missed something.
About Turkish data, per official sources
[编辑]
Mostly to @Irtsokh, who has been kind enough to update the map, and to whom I apologize to for undoing their work. I personally do not know how to edit this map, but a suggestion or two based on data from the Turkish Meteorological Service (and some from infoclimat). According to official data, there needs to be a band of 1800-2000, starting from the northern part of Istanbul (specifically Kumkoy), continuing through the entire northern coast, with a small region of 2000-2500 near Samsun. East of Samsun, sunshine declines sharply, with cities east of Ordu being in the 1200-1600 category, with a few very small regions below 1200 hours. This seems to continue onto Hopa. I am unable to find quality Georgian data, but the data in the Wikipedia pages for Batumi and Sochi imply that the map is largely correct for those regions (except for the line of 2500 and above that sneaks in there for some reason). Uness232 (留言) 07:52, 25 February 2023 (UTC)
- For the Turkish official site, which has daily data, multiplying with 365.25 should work. Uness232 (留言) 07:56, 25 February 2023 (UTC)