File:Change in Average Temperature With Fahrenheit.svg
둘러보기로 이동
검색으로 이동

SVG 파일의 PNG 형식의 미리보기 크기: 666 × 599 픽셀. 다른 해상도: 267 × 240 픽셀 | 533 × 480 픽셀 | 853 × 768 픽셀 | 1,138 × 1,024 픽셀 | 2,276 × 2,048 픽셀 | 960 × 864 픽셀
원본 파일 (SVG 파일, 실제 크기 960 × 864 픽셀, 파일 크기: 236 KB)
캡션
설명
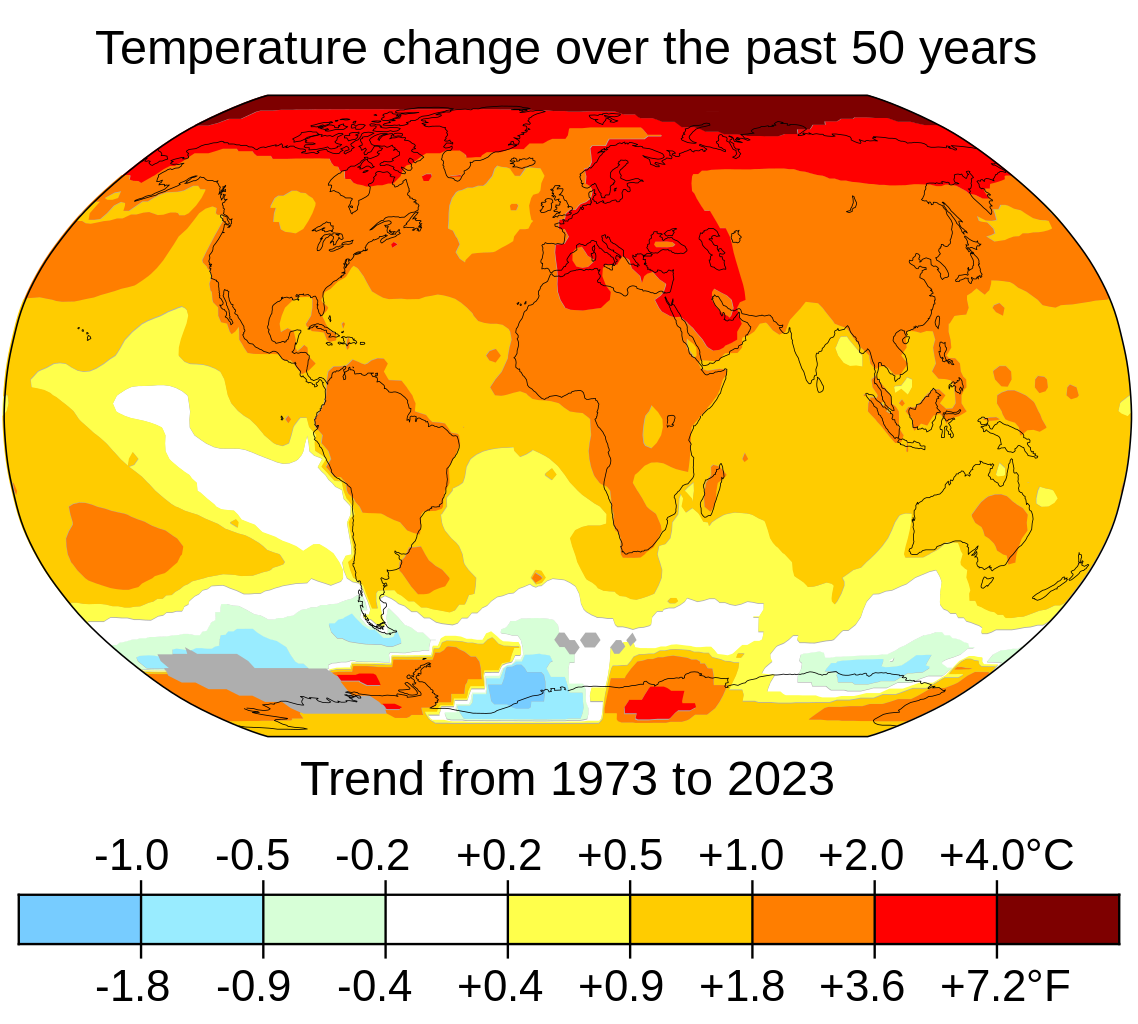
Surface air temperature change over the past 50 years
파일 설명[편집]
| 설명 |
English: Surface air temperature changes to date have been most pronounced in northern latitudes and over land masses. The image uses the trend of annual averages to smooth out climate variability due to factors such as El Niño. The map is improved from the highest quality rendering that NASA’s Scientific Visualization Studio generates, with horizontal and vertical lines removed and with a more legible projection of Kavraiskiy VII. Grey areas in the image have insufficient data for rendering. For a version without Fahrenheit, see File:Change in Average Temperature.svg |
| 날짜 | |
| 출처 | https://data.giss.nasa.gov/gistemp/maps/index_v4.html |
| 저자 | NASA’s Scientific Visualization Studio, Key and Title by uploader (Eric Fisk) |
| 다른 버전 | Arabic (العربية), French |
라이선스[편집]
나는 아래 작품의 저작권자로서, 이 저작물을 다음과 같은 라이선스로 배포합니다:
이 파일은 크리에이티브 커먼즈 저작자표시-동일조건변경허락 4.0 국제 라이선스로 배포됩니다.
- 이용자는 다음의 권리를 갖습니다:
- 공유 및 이용 – 저작물의 복제, 배포, 전시, 공연 및 공중송신
- 재창작 – 저작물의 개작, 수정, 2차적저작물 창작
- 다음과 같은 조건을 따라야 합니다:
- 저작자표시 – 적절한 저작자 표시를 제공하고, 라이센스에 대한 링크를 제공하고, 변경사항이 있는지를 표시해야 합니다. 당신은 합리적인 방식으로 표시할 수 있지만, 어떤 방식으로든 사용권 허가자가 당신 또는 당신의 사용을 지지하는 방식으로 표시할 수 없습니다.
- 동일조건변경허락 – 만약 당신이 이 저작물을 리믹스 또는 변형하거나 이 저작물을 기반으로 제작하는 경우, 당신은 당신의 기여물을 원저작물과 동일하거나 호환 가능한 라이선스에 따라 배포하여야 합니다.
파일 역사
날짜/시간 링크를 클릭하면 해당 시간의 파일을 볼 수 있습니다.
| 날짜/시간 | 섬네일 | 크기 | 사용자 | 설명 | |
|---|---|---|---|---|---|
| 현재 | 2024년 1월 13일 (토) 03:34 | | 960 × 864 (236 KB) | Tofeiku (토론 | 기여) | File uploaded using svgtranslate tool (https://svgtranslate.toolforge.org/). Added translation for ms. |
| 2024년 1월 12일 (금) 21:15 |  | 960 × 864 (234 KB) | Efbrazil (토론 | 기여) | Minor wording and graphic tweaks | |
| 2024년 1월 12일 (금) 20:46 |  | 960 × 864 (234 KB) | Efbrazil (토론 | 기여) | Text tweak: in the last 50 years --> over the last 50 years | |
| 2024년 1월 12일 (금) 19:36 |  | 960 × 864 (234 KB) | Efbrazil (토론 | 기여) | Updated to 2023 annual data, change from average to trend line | |
| 2023년 8월 1일 (화) 11:19 |  | 960 × 864 (276 KB) | Jirka Dl (토론 | 기여) | File uploaded using svgtranslate tool (https://svgtranslate.toolforge.org/). Added translation for cs. | |
| 2023년 8월 1일 (화) 09:23 |  | 960 × 864 (273 KB) | Jirka Dl (토론 | 기여) | File uploaded using svgtranslate tool (https://svgtranslate.toolforge.org/). Added translation for cs. | |
| 2022년 8월 28일 (일) 09:55 |  | 960 × 864 (271 KB) | Kleinpecan (토론 | 기여) | Use en dashes and minuses instead of hyphens | |
| 2022년 1월 13일 (목) 21:17 |  | 960 × 864 (271 KB) | Efbrazil (토론 | 기여) | Updated for 2021 data | |
| 2021년 12월 7일 (화) 23:19 |  | 960 × 864 (298 KB) | Efbrazil (토론 | 기여) | Added Fahrenheit, when move happens, will change base file to drop fahrenheit | |
| 2021년 12월 7일 (화) 01:07 |  | 960 × 816 (293 KB) | Efbrazil (토론 | 기여) | Uploaded own work with UploadWizard |
이 파일을 덮어쓸 수 없습니다.
이 파일을 사용하는 문서
이 파일을 사용하는 문서가 없습니다.
이 파일을 사용하고 있는 모든 위키의 문서 목록
다음 위키에서 이 파일을 사용하고 있습니다:
- ar.wikipedia.org에서 이 파일을 사용하고 있는 문서 목록
- azb.wikipedia.org에서 이 파일을 사용하고 있는 문서 목록
- bcl.wikipedia.org에서 이 파일을 사용하고 있는 문서 목록
- bn.wikipedia.org에서 이 파일을 사용하고 있는 문서 목록
- bs.wikipedia.org에서 이 파일을 사용하고 있는 문서 목록
- el.wikipedia.org에서 이 파일을 사용하고 있는 문서 목록
- en.wikipedia.org에서 이 파일을 사용하고 있는 문서 목록
- Climate
- Developing country
- Instrumental temperature record
- Atlantic humpback dolphin
- Effects of climate change
- Portal:Earth sciences
- Climate change
- User:The Transhumanist
- Rain
- Portal:Climate change/Intro
- Global surface temperature
- Fire and carbon cycling in boreal forests
- Portal:Countries
- Sustainable Development Goal 13
- Portal:Climate change
- Wikipedia:Reference desk/Archives/Miscellaneous/2022 August 7
- User:Bt021/Atlantic humpback dolphin
- Wikipedia:Wikipedia Signpost/2022-09-30/News and notes
- Talk:Climate change/Archive 94
- en.wikiquote.org에서 이 파일을 사용하고 있는 문서 목록
- eo.wikipedia.org에서 이 파일을 사용하고 있는 문서 목록
- fa.wikipedia.org에서 이 파일을 사용하고 있는 문서 목록
- gv.wikipedia.org에서 이 파일을 사용하고 있는 문서 목록
- ha.wikipedia.org에서 이 파일을 사용하고 있는 문서 목록
- hy.wikipedia.org에서 이 파일을 사용하고 있는 문서 목록
- ig.wikipedia.org에서 이 파일을 사용하고 있는 문서 목록
- ig.wiktionary.org에서 이 파일을 사용하고 있는 문서 목록
- ko.wikipedia.org에서 이 파일을 사용하고 있는 문서 목록
- mn.wikipedia.org에서 이 파일을 사용하고 있는 문서 목록
- ms.wikipedia.org에서 이 파일을 사용하고 있는 문서 목록
- pt.wikipedia.org에서 이 파일을 사용하고 있는 문서 목록
- ro.wikipedia.org에서 이 파일을 사용하고 있는 문서 목록
- rw.wikipedia.org에서 이 파일을 사용하고 있는 문서 목록
- so.wikipedia.org에서 이 파일을 사용하고 있는 문서 목록
- sr.wikipedia.org에서 이 파일을 사용하고 있는 문서 목록
이 파일의 더 많은 사용 내역을 봅니다.