File:Greenland Albedo Change.png
Vai alla navigazione
Vai alla ricerca
Dimensioni di questa anteprima: 544 × 599 pixel. Altre risoluzioni: 218 × 240 pixel | 436 × 480 pixel | 697 × 768 pixel | 930 × 1 024 pixel | 1 438 × 1 584 pixel.
File originale (1 438 × 1 584 pixel, dimensione del file: 1,49 MB, tipo MIME: image/png)
Didascalie
Didascalie
Aggiungi una brevissima spiegazione di ciò che questo file rappresenta
Dettagli[modifica]
| Descrizione |
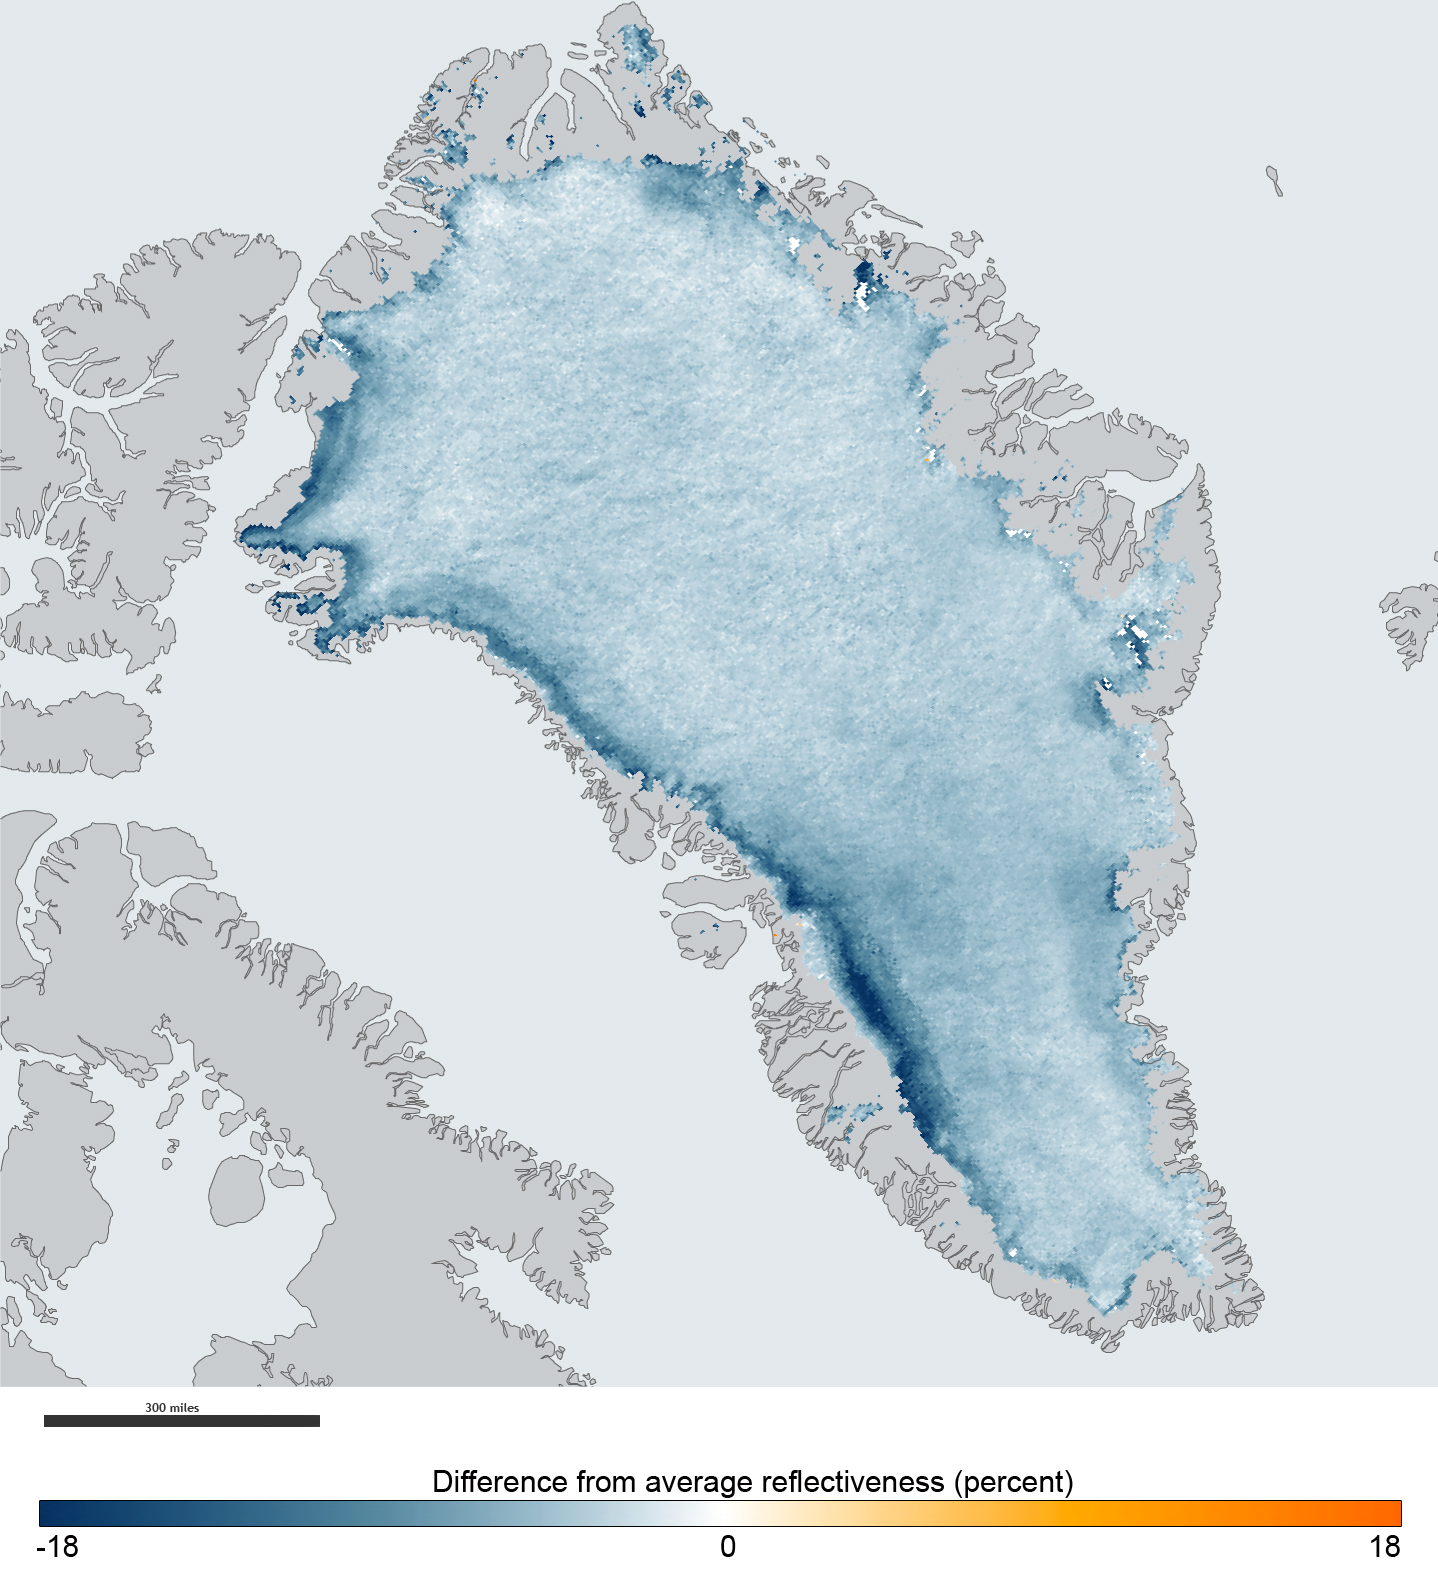
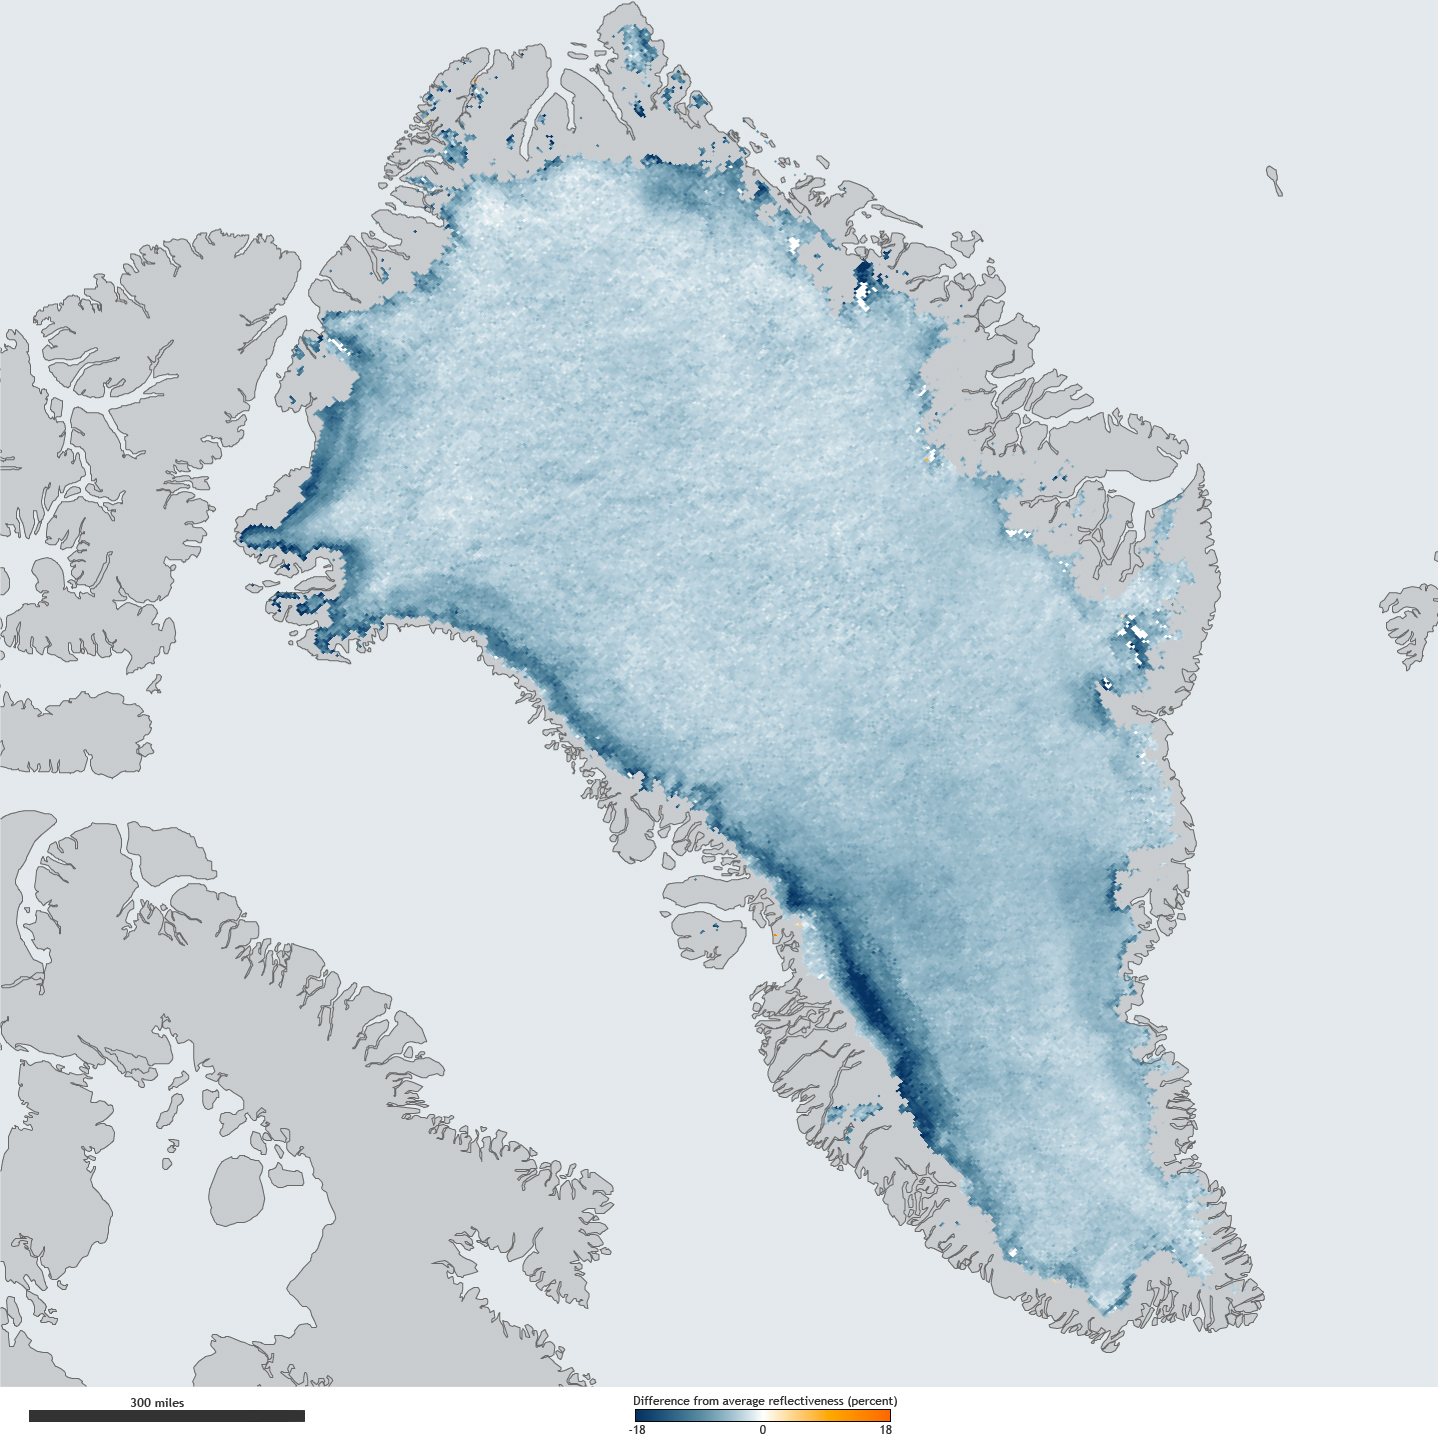
English: The map shows the difference between the amount of sunlight Greenland reflected in the summer of 2011 versus the average percent it reflected between 2000 to 2006. Virtually the entire ice sheet shows some change, with some areas reflecting close to 20 percent less light than a decade ago. The map is based on observations from the Moderate Resolution Imaging Spectroradiometer (MODIS) instruments on NASA’s Terra and Aqua satellites. It was produced as part of the National Oceanic and Atmospheric Administration’s Arctic Report Card. |
| Data | |
| Fonte | http://earthobservatory.nasa.gov/IOTD/view.php?id=76916 http://eoimages.gsfc.nasa.gov/images/imagerecords/76000/76916/greenlandalbedo_mod_2011_lrg.jpg |
| Autore | Map by NOAA’s climate.gov team, based on NASA satellite data processed by Jason Box, Byrd Polar Research Center, the Ohio State University. Scanning electron microscope photos courtesy the Electron and Confocal Microscopy Laboratory, USDA Agricultural Research Service. |
Licenza[modifica]
| Questo file è nel pubblico dominio perché creato dalla NASA. La politica sul copyright della NASA afferma che «il materiale della NASA non è protetto da copyright a meno che non sia specificato altrimenti». (NASA copyright policy e JPL Image Use Policy). | ||
 |
Attenzione:
|
Cronologia del file
Fare clic su un gruppo data/ora per vedere il file come si presentava nel momento indicato.
| Data/Ora | Miniatura | Dimensioni | Utente | Commento | |
|---|---|---|---|---|---|
| attuale | 19:00, 12 feb 2012 | | 1 438 × 1 584 (1,49 MB) | Sagredo (discussione | contributi) |
Impossibile sovrascrivere questo file.
Utilizzo del file
Nessuna pagina utilizza questo file.
Utilizzo globale del file
Anche i seguenti wiki usano questo file:
- Usato nelle seguenti pagine di bn.wikipedia.org:
- Usato nelle seguenti pagine di cs.wikipedia.org:
- Usato nelle seguenti pagine di de.wikipedia.org:
- Usato nelle seguenti pagine di en.wikipedia.org:
- Usato nelle seguenti pagine di es.wikipedia.org:
- Usato nelle seguenti pagine di eu.wikipedia.org:
- Usato nelle seguenti pagine di fr.wikipedia.org:
- Usato nelle seguenti pagine di ga.wikipedia.org:
- Usato nelle seguenti pagine di id.wikipedia.org:
- Usato nelle seguenti pagine di it.wikipedia.org:
- Usato nelle seguenti pagine di nl.wikipedia.org:
- Usato nelle seguenti pagine di no.wikipedia.org:
- Usato nelle seguenti pagine di pl.wikipedia.org:
- Usato nelle seguenti pagine di vi.wikipedia.org:
- Usato nelle seguenti pagine di zh.wikipedia.org: