File:South Africa 2011 dominant language map.svg
Pereiti į navigaciją
Jump to search

Rinkmenos SVG peržiūros PNG dydisː 684 × 599 taškų. Kitos 6 rezoliucijos: 274 × 240 taškų | 548 × 480 taškų | 876 × 768 taškų | 1 168 × 1 024 taškų | 2 337 × 2 048 taškų | 809 × 709 taškų.
Pradinė rinkmena (SVG rinkmena, formaliai 809 × 709 taškų, rinkmenos dydis: 798 KiB)
Captions
Captions
Add a one-line explanation of what this file represents
Aprašymas
[keisti]
| Aprašymas |
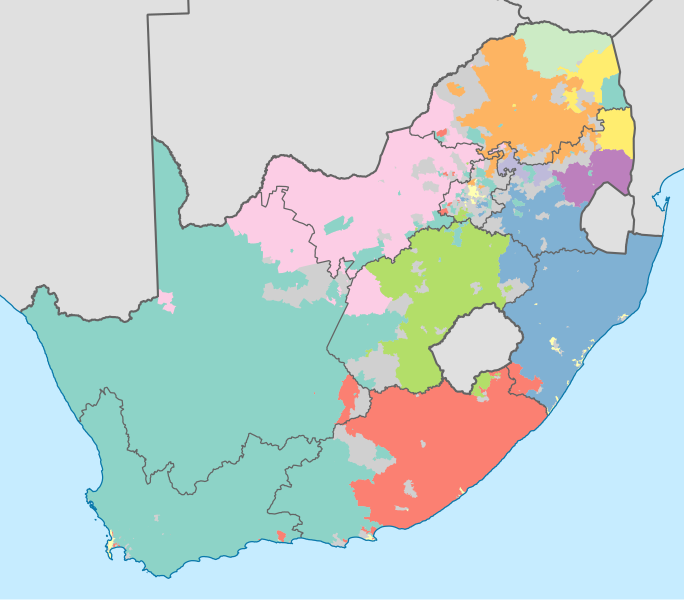
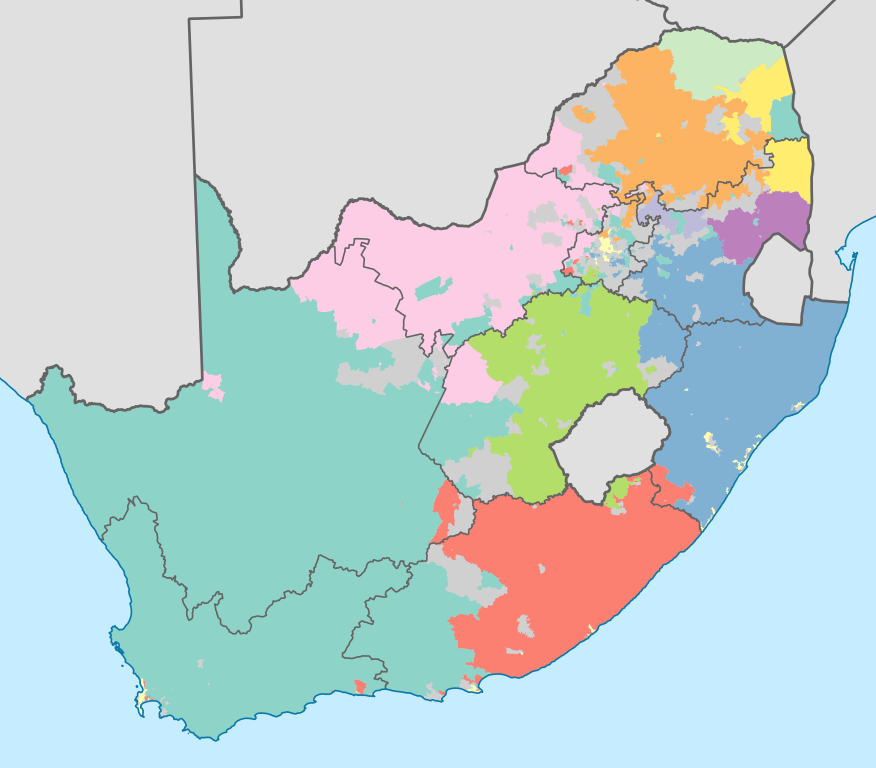
English: Map showing the dominant home languages in South Africa, based on ward-level data from the 2011 census. In this context, a language is dominant if it more than 50% of the population in a ward speak it at home, or more than 33% speak it and no other language is spoken by more than 25%.
English
Afrikaans
isiNdebele
isiXhosa
isiZulu
Sesotho sa Leboa
Sesotho
Setswana
siSwati
Tshivenda
Xitsonga
No language dominant
Projection is Albers Equal-Area Conic, with standard parallels at 25.5° S and 31.5° S, and origin at 28.5° S 24.5° E. |
| Data | |
| Šaltinis | Statistics South Africa's Census 2011 is the source of the basic population data. The map results from my own processing of the data. For ward boundaries see File:South Africa electoral wards 2011 blank.svg. |
| Autorius | Htonl |
| Kitos versijos |
South Africa 2011 dominant language map (hex cells).svg: .svg) |
Licencija
[keisti]
The following license applies to the population data on which the map is based:

|
Šio failo autorinių teisių savininkas, Stats SA, leidžia naudoti šį failą bet kokiam tikslui, su sąlyga, kad autorinių teisių savininkas tinkamai nurodytas. Perskyrimas, išvestiniai darbai, naudojimas komerciniams tikslams ir kiti naudojimai yra uždrausti. |
Autoriaus nurodymas:
"the user acknowledges Stats SA as the source of the basic data wherever they process, apply, utilise, publish or distribute the data, and also that they specify that the relevant application and analysis (where applicable) result from their own processing of the data" [1]
|
The following tag applies to the map itself:
| Aš, šio darbo autorinių teisių savininkas, šį darbą skelbiu viešo naudojimo. Tai galioja visame pasaulyje. Kai kuriose šalyse tai negali būti legaliai leidžiama; jei taip: Suteikiu teisę naudoti šį darbą bet kokiai paskirčiai, be jokių sąlygų, nebent jos reikalaujamos įstatymų. |
Rinkmenos istorija
Paspauskite ant datos/laiko, kad pamatytumėte rinkmeną tokią, kokia ji buvo tuo metu.
| Data/Laikas | Miniatiūra | Matmenys | Naudotojas | Paaiškinimas | |
|---|---|---|---|---|---|
| dabartinis | 21:09, 18 lapkričio 2012 | | 809 × 709 (798 KiB) | Htonl (aptarimas | indėlis) | =={{int:filedesc}}== {{Information |Description={{en|1=Map showing the dominant home languages in South Africa, based on ward-level data from the 2011 census. In this context, a language is dominant if it more than 50% of the population in a ward speak... |
Jūs negalite perrašyti šios rinkmenos.
Rinkmenos naudojimas
Šie puslapiai naudoja šią rinkmeną:
Visuotinis rinkmenos naudojimas
Ši rinkmena naudojama šiose viki svetainėse:
- Naudojama af.wikipedia.org
- Naudojama cs.wikipedia.org
- Naudojama de.wikipedia.org
- Naudojama dsb.wikipedia.org
- Naudojama en.wikipedia.org
- Naudojama eo.wikipedia.org
- Naudojama frr.wikipedia.org
- Naudojama fr.wikipedia.org
- Naudojama fr.wiktionary.org
- Naudojama he.wikipedia.org
- Naudojama it.wikipedia.org
- Naudojama ka.wikipedia.org
- Naudojama ko.wikipedia.org
- Naudojama lb.wikipedia.org
- Naudojama ml.wikipedia.org
- Naudojama mzn.wikipedia.org
- Naudojama no.wikipedia.org
- Naudojama pt.wikipedia.org
- Naudojama rm.wikipedia.org
- Naudojama ro.wikipedia.org
- Naudojama ru.wikipedia.org
- Naudojama sh.wikipedia.org
- Naudojama simple.wikipedia.org
- Naudojama sr.wikipedia.org
- Naudojama ss.wikipedia.org
- Naudojama sv.wikipedia.org
- Naudojama sw.wikipedia.org
- Naudojama szl.wikipedia.org
- Naudojama te.wikipedia.org
- Naudojama tg.wikipedia.org
- Naudojama tr.wikipedia.org
- Naudojama uk.wikipedia.org
- Naudojama xh.wikipedia.org
- Naudojama zh.wikipedia.org
Žiūrėti visuotinį šios rinkmenos naudojimą.