File:U.S. 2016 to 2020 presidential election swing.svg
둘러보기로 이동
검색으로 이동

SVG 파일의 PNG 형식의 미리보기 크기: 555 × 352 픽셀. 다른 해상도: 320 × 203 픽셀 | 640 × 406 픽셀 | 1,024 × 649 픽셀 | 1,280 × 812 픽셀 | 2,560 × 1,624 픽셀
원본 파일 (SVG 파일, 실제 크기 555 × 352 픽셀, 파일 크기: 1,018 KB)
캡션
설명
이 파일이 나타내는 바에 대한 한 줄 설명을 추가합니다
파일 설명
[편집]
| 설명 |
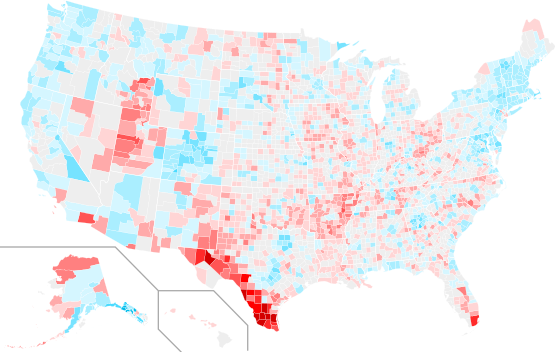
English: Swing in county margins from United States presidential election (2016) to United States presidential election (2020).
Democratic—+>15%
Democratic—+12.5-15%
Democratic—+10-12.5%
Democratic—+7.5-10%
Democratic—+5-7.5%
Democratic—+2.5-5%
Democratic—+<2.5%
<2%
Republican—+<2.5%
Republican—+2.5-5%
Republican—+5-7.5%
Republican—+7.5-10%
Republican—+10-12.5%
Republican—+12.5-15%
Republican—+>15%
Data unavailable |
| 날짜 | 아래를 참조하세요. |
| 출처 |
이 파일은 다음에 의해 파생됨: USA Counties with names.svg |
| 저자 | Magog the Ogre |
라이선스
[편집]
나는 아래 작품의 저작권자로서, 이 저작물을 다음과 같은 라이선스로 배포합니다:
| 이 파일은 크리에이티브 커먼즈 CC0 1.0 보편적 퍼블릭 도메인 귀속에 따라 이용할 수 있습니다. | |
| 저작물에 본 권리증서를 첨부한 자는 법률에서 허용하는 범위 내에서 저작인접권 및 관련된 모든 권리들을 포함하여 저작권법에 따라 전 세계적으로 해당 저작물에 대해 자신이 갖는 일체의 권리를 포기함으로써 저작물을 퍼블릭 도메인으로 양도하였습니다. 저작권자의 허락을 구하지 않아도 이 저작물을 상업적인 목적을 포함하여 모든 목적으로 복제, 수정·변경, 배포, 공연·실연할 수 있습니다.
|
| 주석 | 이 이미지에는 주석이 있습니다: 공용에서 주석을 보기 |
파일 역사
날짜/시간 링크를 클릭하면 해당 시간의 파일을 볼 수 있습니다.
| 날짜/시간 | 섬네일 | 크기 | 사용자 | 설명 | |
|---|---|---|---|---|---|
| 현재 | 2022년 6월 23일 (목) 21:56 | | 555 × 352 (1,018 KB) | Ngfsmg (토론 | 기여) | State lines length |
| 2021년 11월 13일 (토) 00:07 |  | 555 × 352 (1,018 KB) | Yet another newcomer (토론 | 기여) | Added Alaska county swings from Dave's Redistricting | |
| 2020년 12월 18일 (금) 02:08 |  | 555 × 352 (925 KB) | Magog the Ogre (토론 | 기여) | weekly update 12/14 | |
| 2020년 12월 7일 (월) 22:47 |  | 555 × 352 (925 KB) | Magog the Ogre (토론 | 기여) | weekly update 12/6 | |
| 2020년 11월 29일 (일) 00:59 |  | 555 × 352 (925 KB) | Magog the Ogre (토론 | 기여) | weekly update from upstream data | |
| 2020년 11월 28일 (토) 23:03 |  | 555 × 352 (924 KB) | Magog the Ogre (토론 | 기여) | Use both parties swing, not just winner | |
| 2020년 11월 22일 (일) 13:41 |  | 555 × 352 (924 KB) | Magog the Ogre (토론 | 기여) | update to 2020 data set 0.5 | |
| 2020년 11월 10일 (화) 04:40 |  | 555 × 352 (925 KB) | Magog the Ogre (토론 | 기여) | daily update | |
| 2020년 11월 9일 (월) 04:33 |  | 555 × 352 (925 KB) | Magog the Ogre (토론 | 기여) | {{Information |description={{en|1=Swing in county margins from United States presidential election (2016) to United States presidential election (2020). {{legend|#00a1c8|Democratic—+>30%}} {{legend|#00bdec|Democratic—+25-30%}} {{legend|#09ceff|Democratic—+20-25%}} {{legend|#4bdbff|Democratic—+15-20%}} {{legend|#77e3ff|Democratic—+10-15%}} {{legend|#AAEEFF|Democratic—+5-10%}} {{legend|#D5F6FF|Democr... |
이 파일을 덮어쓸 수 없습니다.
이 파일을 사용하는 문서
다음 문서 6개가 이 파일을 사용하고 있습니다:
- User:Magog the Ogre/Political maps/2020 December 1-10
- User:Magog the Ogre/Political maps/2020 December 11-20
- User:Magog the Ogre/Political maps/2020 November 1-10
- User:Magog the Ogre/Political maps/2020 November 21-30
- User:Magog the Ogre/Political maps/2021 November 11-20
- User:Magog the Ogre/Political maps/2022 June 21-30
이 파일을 사용하고 있는 모든 위키의 문서 목록
다음 위키에서 이 파일을 사용하고 있습니다:
- en.wikipedia.org에서 이 파일을 사용하고 있는 문서 목록
- he.wikipedia.org에서 이 파일을 사용하고 있는 문서 목록
- it.wikipedia.org에서 이 파일을 사용하고 있는 문서 목록
- ko.wikipedia.org에서 이 파일을 사용하고 있는 문서 목록
- no.wikipedia.org에서 이 파일을 사용하고 있는 문서 목록