Category:Atmospheric pressure maps
Jump to navigation
Jump to search
Subcategories
This category has the following 5 subcategories, out of 5 total.
A
C
G
M
S
Media in category "Atmospheric pressure maps"
The following 32 files are in this category, out of 32 total.
-
 02apr2005.PNG 750 × 489; 30 KB
-
 04nov2002.PNG 750 × 489; 23 KB
-
 04nov2005.PNG 750 × 489; 25 KB
-
 09may.png 800 × 560; 194 KB
-
 09may2004.PNG 750 × 489; 22 KB
-
 27oct2004.PNG 750 × 489; 20 KB
-
 30aug06.png 750 × 489; 18 KB
-
-
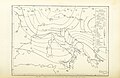
 91 of 'Eclectic Physical Geography' (11202334044).jpg 1,296 × 2,066; 685 KB
-
 Afik.png 750 × 489; 21 KB
-
 April06.png 750 × 489; 25 KB
-
 April2006 (34).PNG 750 × 489; 24 KB
-
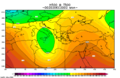
 CPC-NWS-NOAA CDAS 200-hPa HT Anoms 09JAN2019.png 538 × 305; 184 KB
-
 Dec2013msl.gif 1,024 × 768; 3.16 MB
-
 Ecuadores.png 2,753 × 1,335; 233 KB
-
 Former lowest measured atmospheric pressure of Minnesota.jpg 522 × 400; 87 KB
-
 Hann Atlas der Meteorologie 7.jpg 1,180 × 975; 407 KB
-
 Hann Atlas der Meteorologie 8.jpg 1,180 × 975; 397 KB
-
 Isobar Map (PSF).png 4,068 × 2,691; 352 KB
-
 Isobaren bei Orkan.png 1,024 × 678; 397 KB
-
 Isobaren bei Orkan.svg 1,024 × 678; 742 KB
-
 Nasa-hi-air-pr-avg.png 310 × 187; 5 KB
-
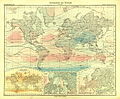
 Nouveau Larousse illustré - dictionnaire universel encyclopédique (1898) (14801609173).jpg 3,184 × 2,390; 1.09 MB
-
 NRL MRY 500hpa+SLP 20150729.jpg 1,000 × 700; 225 KB
-
 PSM V32 D667 The seven fundamental shapes of isobars.jpg 1,263 × 781; 73 KB
-
 SeaLevelPressure-Asia-Jan.pdf 1,308 × 1,093; 550 KB
-
 SeaLevelPressure-Asia-Jan.png 872 × 729; 293 KB
-
 SeaLevelPressure-Asia-Jul.png 872 × 735; 316 KB
-
 SeaLevelPressure-World-Jan.png 869 × 668; 304 KB
-

-

-
 Wetterkarte mit Okklusion.png 3,500 × 1,650; 1.56 MB


%27_(11247181234).jpg)
.jpg)


.PNG)


.png)


_(14801609173).jpg)


