Category:Charts showing data through 2022
Jump to navigation
Jump to search
Deutsch: Statistiken bis zu und einschließlich 2022. Viele Grafiken fehlen hier noch – bitte hinzufügen.
English: Charts showing data up to and including 2022.
- Many charts are still missing – please help categorizing charts, e.g. from here. Outdated charts can often be updated. Only charts on notable subjects with specified data source(s) should be included.
| NO WIKIDATA ID FOUND! Search for Charts showing data through 2022 on Wikidata | |
| Upload media |
Subcategories
This category has the following 2 subcategories, out of 2 total.
G
- Global Carbon Budget 2023 (24 F)
Media in category "Charts showing data through 2022"
The following 67 files are in this category, out of 67 total.
-
 Annual World Population Since 10,000 BC.png 2,674 × 1,881; 209 KB
-
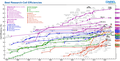 Best Research-Cell Efficiencies.png 3,217 × 1,638; 208 KB
-
 BK HFC32.jpg 809 × 374; 50 KB
-
 BK MC.jpg 820 × 374; 44 KB
-
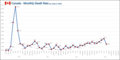 Canada - Monthly Death Rate (Jul 14, 2023).png 1,577 × 786; 101 KB
-
 China-electricity-prod-source-stacked.svg 850 × 600; 39 KB
-
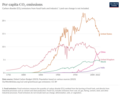 CO2-emissions-per-capita.png 3,400 × 2,706; 767 KB
-
 Co2-long-term-concentration.png 3,400 × 2,400; 655 KB
-
 Damage-costs-from-natural-disasters.png 3,400 × 2,400; 366 KB
-
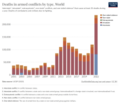 Deaths in armed conflicts by type from 2001 to 2022.png 3,400 × 2,944; 625 KB
-
 Deaths in armed conflicts by type from 2003 to 2022.png 3,400 × 2,944; 626 KB
-
 Divestment growth en.svg 1,200 × 600; 41 KB
-
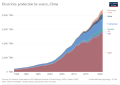
 Electricity generation in China by source.png 3,400 × 2,765; 779 KB
-
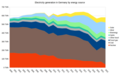 Electricity generation in Germany by energy source.png 1,789 × 1,100; 140 KB
-
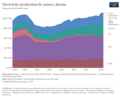
 Electricity generation in Ukraine by source and year.png 3,400 × 2,765; 818 KB
-
 Electricity-prod-source-stacked.png 3,400 × 2,765; 769 KB
-
 Energiemix Deutschland.svg 800 × 400; 184 KB
-
 Energy consumption by source Australia.png 3,400 × 3,154; 1.06 MB
-
 Energy consumption by source by year in Ukraine.png 3,400 × 3,154; 1.06 MB
-
 Energy consumption by source in Bulgaria.png 3,400 × 3,154; 1.17 MB
-
 Food Price Index US.webp 1,620 × 388; 11 KB
-
 Global Carbon Budget Results - Fossil CO2 emissions charts.png 2,067 × 1,737; 186 KB
-
 Global climate forcing of the industrial era.png 867 × 639; 73 KB
-
 HATS Nitrous Oxide growth rate.png 695 × 385; 43 KB
-
 HCFC141b concentration.jpg 809 × 374; 52 KB
-
 HCFC142b concentration.jpg 809 × 374; 51 KB
-
 HCFC22 concentration.jpg 818 × 374; 53 KB
-
 Hexafluoroethane concentration.jpg 818 × 374; 57 KB
-
 HFC125 concentration.jpg 809 × 374; 49 KB
-
 HFC143a concentration.jpg 809 × 374; 51 KB
-
 HFC152a concentration.jpg 809 × 374; 69 KB
-
 Historical cost of computer memory and storage.svg 822 × 483; 52 KB
-
 Historical-cost-of-computer-memory-and-storage OWID.svg 850 × 600; 26 KB
-
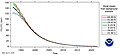
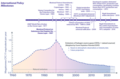 International Policy Milestones by NOAA.png 1,089 × 721; 136 KB
-
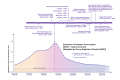 International Policy Milestones by NOAA.svg 750 × 500; 51 KB
-
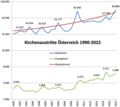 Kirchenaustritte Österreich.png 973 × 865; 119 KB
-
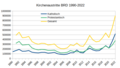 Kirchenaustritte-BRD-1990-2022-V2.png 606 × 341; 40 KB
-
 Kirchenaustritte-BRD-1990-2022.png 605 × 341; 38 KB
-
 Land vs Ocean Temperature.svg 960 × 695; 18 KB
-
 Life expectancy post-COVID.png 695 × 628; 224 KB
-
 Monkeypox cumulative-cases linear-plot.svg 850 × 600; 59 KB
-
 Nanosatellites launched by years.svg 512 × 288; 118 KB
-
 NASA-Satellite-sea-level-rise-observations.jpg 1,000 × 813; 113 KB
-
 Netherlands electricity generation by source.png 1,194 × 759; 87 KB
-
 New methane abatement policies and measures.png 1,920 × 1,080; 198 KB
-
 Nitrogen Trifluoride concentration.jpg 820 × 374; 50 KB
-
 Nuclear power generation in different countries.svg 850 × 600; 61 KB
-
 Nuclear power generation.svg 850 × 600; 30 KB
-
 Nuclear-weapons-proliferation.png 3,400 × 2,400; 369 KB
-
 Number of publications per year on AI ethics or AI governance.jpg 3,362 × 1,511; 213 KB
-
 Number-of-deaths-from-natural-disasters.png 3,400 × 2,400; 430 KB
-
 Number-of-natural-disaster-events-Our World In Data.png 3,400 × 2,400; 418 KB
-
 Portals pageviews.png 906 × 548; 351 KB
-
 Solar energy generation.svg 850 × 600; 69 KB
-
 Stromerzeugung in Deutschland nach Energieträger.png 1,787 × 1,107; 147 KB
-
 Studies about pandemic prevention in PubMed by year (full).png 2,048 × 1,792; 119 KB
-
-

-
 Switzerland electricity generation by source.png 1,194 × 759; 78 KB
-
 Tetrafluoromethane concentration.jpg 811 × 374; 49 KB
-
 Timeline of U.S. homicide rate. FBI and CDC.png 2,048 × 1,462; 321 KB
-
 TotalFA and GA.png 544 × 486; 17 KB
-
 Trials of nootropics in PubMed.png 2,048 × 1,792; 198 KB
-
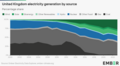 United Kingdom electricity generation by source.png 1,194 × 759; 95 KB
-
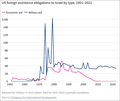 US foreign assistance obligations to Israel by type, 1951-2022.png 1,082 × 913; 77 KB
-
 VitalFA and GA.png 525 × 465; 25 KB
-
 Wind generation by country.svg 850 × 600; 61 KB


.png)


.png)
.png)


