Category:Climate change diagrams
Jump to navigation
Jump to search
Diagrams and graphics related to any aspect of climate change
Subcategories
This category has the following 9 subcategories, out of 9 total.
Media in category "Climate change diagrams"
The following 200 files are in this category, out of 616 total.
(previous page) (next page)-

-

-

-

-

-

-

-

-

-

-

-

-

-
 16-008-NASA-2015RecordWarmGlobalYearSince1880-20160120 (120k-edited).png 400 × 225; 119 KB
-
 16-008-NASA-2015RecordWarmGlobalYearSince1880-20160120.png 1,920 × 1,080; 2.22 MB
-

-
 1880- Global average sea surface temperature - global warming.svg 1,200 × 900; 8 KB
-
 1920s -- Record high and low temperatures - U.S. - Climate Central.svg 1,040 × 750; 4 KB
-
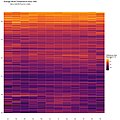
 1940-2023 Global surface temperature - stacked - Copernicus.jpg 3,060 × 1,980; 381 KB
-

-
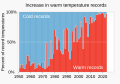
 1951+ Percent of global area at temperature records - Seasonal comparison - NOAA.svg 2,000 × 1,400; 23 KB
-
 1951- Percent of record temperatures that are cold or warm records.svg 1,000 × 700; 6 KB
-

-
 1951- Warm and cold record temperatures - bar chart.svg 1,000 × 700; 6 KB
-
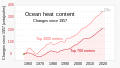 1955- Ocean heat content - NOAA.svg 1,200 × 675; 4 KB
-
 1979- Radiative forcing - climate change - global warming - EPA NOAA.svg 1,100 × 750; 15 KB
-
 2004 Worldwide Energy Sources graph.png 688 × 599; 9 KB
-
 2004 Worldwide Energy Sources graph.svg 688 × 599; 29 KB
-
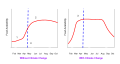
 2004- "Climate change" as a search term - Google trends.svg 1,000 × 750; 21 KB
-
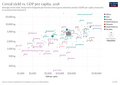
 2010- Cost of renewable energy - IRENA.svg 1,000 × 750; 8 KB
-

-

-
 2015-2100 Impacts of global warming on glaciers and sea level rise.svg 1,200 × 800; 3 KB
-
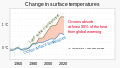
 20160411 Global warming line chart (1850-2016) - Ed Hawkins.png 1,747 × 1,122; 301 KB
-
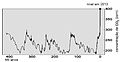
 20190708 Stripe graphic of sea level change (1880-2013) Richard Selwyn Jones.png 3,200 × 1,800; 56 KB
-
 20190731 Central England Temperature (CET) (annual mean, beginning in 1659).png 3,323 × 1,351; 136 KB
-
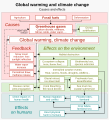
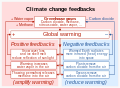
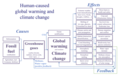 20200101 Global warming - climate change - causes effects feedback.png 3,287 × 2,106; 586 KB
-

-
-

-

-

-

-

-

-
-

-

-
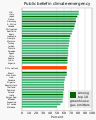
 20210822 Global warming - warming stripes bar chart.svg 1,000 × 750; 14 KB
-

-

-

-

-
-

-

-
-

-
 2022 Counting the cost of disasters - climate change - Christian Aid.svg 1,600 × 900; 2 KB
-

-

-

-

-
-

-

-

-

-
-
 43247 2020 10 Fig3 HTML.webp 949 × 761; 76 KB
-
 6m Sea Level Rise (cropped Africa).jpg 521 × 521; 46 KB
-

-
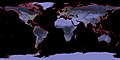 6m Sea Level Rise.jpg 2,048 × 1,024; 248 KB
-
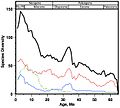
 800px Briffa tree ring density vs temperature 1880-2000 cs.png 2,500 × 1,341; 234 KB
-

-
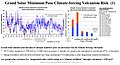 A grand solar minimum poses catastrophic volcanism risk.jpg 960 × 518; 175 KB
-
 ACEA agreement progress.png 393 × 275; 9 KB
-
-
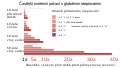
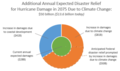
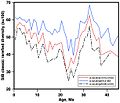
 Additional health expenditures due to climate change 2100.png 692 × 457; 58 KB
-
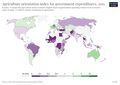 Agriculture-orientation-index (OWID 0018).png 850 × 600; 102 KB
-
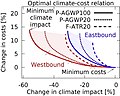 Air traffic optimal climat-cost relation.jpg 1,111 × 886; 197 KB
-
 All palaeotemps.png 1,753 × 565; 90 KB
-
 All palaeotemps.svg 1,760 × 513; 136 KB
-
 All palaeotempsport.svg 1,760 × 513; 127 KB
-
 Alt gmsl seas not rem.jpg 700 × 500; 142 KB
-
 Alt gmsl seas rem.jpg 700 × 500; 136 KB
-
 Amoc-index.svg 1,000 × 500; 129 KB
-

-
 Annual mass balances and driving components of the GrIS.webp 971 × 795; 79 KB
-
 Annual mean temperature evolution in the Arctic.webp 1,000 × 1,017; 129 KB
-
 Anthropogenic global warming hijacked natural climate change.jpg 960 × 518; 158 KB
-
 Arctic-sea-ice-coverage-19352014 (OWID 0091).png 850 × 600; 61 KB
-

-
 Atmosphericco2concentration.jpg 720 × 540; 92 KB
-
 Atmosphericmethaneconcentrations.jpg 720 × 540; 92 KB
-
 Atmosphericn2oconcentrations.jpg 720 × 540; 92 KB
-
 Atmosphère évolution.jpg 843 × 728; 153 KB
-
 Attribution of global warming.jpg 2,251 × 1,806; 226 KB
-
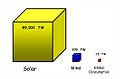 Available Energy-2.jpg 1,067 × 702; 84 KB
-
 Available Energy-3-es.png 1,067 × 702; 45 KB
-
 Available Energy-3.png 1,067 × 702; 50 KB
-
 Available Energy-3.svg 512 × 219; 22 KB
-
 Available Energy-4.svg 541 × 856; 26 KB
-
 Available Energy-pl.svg 541 × 856; 26 KB
-
 Average-precipitation-per-year (OWID 0083).png 850 × 600; 105 KB
-
 Aviation Effective Radiative Forcing components, 2018 (mW per m²).svg 609 × 376; 202 KB
-
 Aviation Efficiency (RPK per kg CO2).svg 600 × 553; 88 KB
-
 Beach-litter (OWID 0081).png 850 × 600; 92 KB
-

-
 Biophysical Effects on Global Temperature From Deforestation by 10° Latitude Band.jpg 4,223 × 3,795; 640 KB
-
 Blüte Reife Zusammenhang Krems.JPG 1,234 × 842; 155 KB
-
 Bp-country-coverage (OWID 0136).png 850 × 600; 87 KB
-
 Briffa-tree ring density vs temperature 1880-2000.jpg 1,032 × 554; 62 KB
-
 Budget-to-manage-invasive-alien-species (OWID 0135).png 850 × 600; 101 KB
-
 But-so-is-the-quality-of-their-local-environment (OWID 0133).png 850 × 600; 98 KB
-
 But-so-is-the-quality-of-their-local-environment-finn (OWID 0134).png 850 × 600; 101 KB
-
 Cambio climatico (french).jpg 600 × 586; 66 KB
-
 Cambio climático.png 600 × 582; 181 KB
-
 Cambio-climático.jpg 1,299 × 945; 296 KB
-
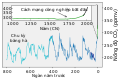
 Carbon Dioxide 400kyr-dioxido de carbono 400 k-anios-es.png 600 × 436; 54 KB
-
 Carbon Dioxide 400kyr-fi.png 600 × 436; 26 KB
-
 Carbon Dioxide 400kyr-pt.jpg 900 × 464; 101 KB
-
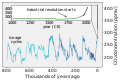
 Carbon Dioxide 400kyr.png 600 × 436; 26 KB
-
 Carbon Dioxide 800kyr-vi.svg 502 × 339; 50 KB
-
 Carbon Dioxide 800kyr.svg 502 × 339; 52 KB
-
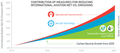 Carbon Offsetting and Reduction Scheme for International Aviation.png 1,919 × 842; 213 KB
-
 Cenovus Unit Oil Production.jpg 636 × 434; 36 KB
-

-

-

-
-

-
-

-
-

-

-
-

-

-

-

-

-

-

-

-
 Cereal production estimate 2020.png 1,350 × 625; 32 KB
-
 Cereal production estimate 2050 as climate change.png 1,350 × 625; 33 KB
-
 Cereal production estimate 2080 asclimate change.png 1,350 × 625; 33 KB
-
 Cereal-yield-vs-extreme-poverty (OWID 0109).png 850 × 600; 74 KB
-
 Cereal-yield-vs-extreme-poverty-scatter (OWID 0110).png 850 × 600; 117 KB
-
 Cereal-yield-vs-gdp-per-capita (OWID 0108).png 850 × 600; 92 KB
-
 Cereal-yields-vs-gdp-per-capita (OWID 0171).png 850 × 600; 82 KB
-
 Cereals-imports-vs-exports (OWID 0168).png 850 × 600; 106 KB
-
 CET 1659 - 2014 using Hadley Centre Data.png 696 × 473; 69 KB
-

-
 Change-global-hunger-index-pop-growth (OWID 0160).png 850 × 600; 103 KB
-
 Change-in-total-mangrove-area (OWID 0159).png 850 × 600; 92 KB
-
 Change-population-gdp-meat (OWID 0153).png 850 × 600; 54 KB
-
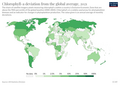 Chlorophyll-a-deviation-from-the-global-average (OWID 0149).png 850 × 600; 114 KB
-
 Ck8gRgSWUAAKGIA.jpg 1,200 × 1,200; 210 KB
-
 Climate Change and Bird Reproduction.svg 512 × 269; 71 KB
-
 Climate change historic and predicted 2003.png 1,354 × 902; 98 KB
-

-
 Climate Change Indicators - Temperatures Worldwide (9495931098).png 670 × 567; 55 KB
-
 Climate change Kyrgyzstan glacier melting 03.pdf 1,275 × 1,650; 46 KB
-
 Climate change numbered.svg 512 × 497; 237 KB
-
 Climate Change Switchboard (46198229225).jpg 1,280 × 720; 98 KB
-
 Climate Change System Dynamics.jpg 946 × 1,280; 273 KB
-
 Climate change unlabeled.svg 512 × 497; 236 KB
-
 Climate change-en.svg 512 × 497; 240 KB
-
 Climate change-es.svg 512 × 497; 286 KB
-
 Climate change-fr.svg 512 × 497; 238 KB
-
 Climate Ethics Cartogram.jpg 1,224 × 792; 258 KB
-
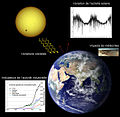
 Climate follows solar activity.jpg 960 × 518; 170 KB
-

-
 Climate Funds.jpg 595 × 510; 50 KB
-

-

-

-
 Climate-change 70ma.png 1,035 × 787; 115 KB
-
 Climate-tipping-points-de.svg 2,479 × 1,409; 420 KB
-
 Climate-tipping-points-en.svg 2,479 × 1,409; 420 KB
-
 Climate-tipping-points-es.svg 2,479 × 1,409; 440 KB
-
 Climate-tipping-points-fr.svg 2,760 × 1,398; 274 KB
-
 Climate-tipping-points-interactions-de.svg 2,030 × 1,398; 373 KB
-
 Climate-tipping-points-interactions-no.svg 2,030 × 1,398; 347 KB
-
 Climate-tipping-points-interactions-pl.svg 2,030 × 1,398; 347 KB
-
 Climate-tipping-points-pl.svg 2,760 × 1,398; 293 KB
-
 CO2 40k.png 1,000 × 546; 10 KB
-
 CO2 60Mio.jpg 626 × 281; 77 KB
-
 Co2-temperature-records-de.svg 720 × 540; 170 KB
-
 CO2-Variationen schematisch.svg 616 × 384; 14 KB
-
 CO2-variations hg.png 1,155 × 806; 186 KB
-
 CO2-variations hg.svg 612 × 428; 8 KB
-
 CO2-variations-d hg.png 1,155 × 806; 191 KB
-
 CO2-variations-d hg.svg 612 × 428; 8 KB
-
 Co2.recent.ch.png 585 × 447; 7 KB
-
 Coal-production-in-the-united-kingdom (OWID 0260).png 850 × 600; 64 KB
-
 Combined potential emissions of all carbon bombs versus 1.5 °C carbon budget.jpg 1,500 × 1,446; 272 KB


.png)


_-_Global_warming_-_NOAA.svg)


_-_Global_warming.svg)


_-_Ed_Hawkins.png)
_Richard_Selwyn_Jones.png)


.jpg)
.jpg)


.png)


_data._(46089932074).jpg)


.png)


.png)
.svg)
.svg)
.png)


.png)

.png)
.png)
.png)
.jpg)


.png)
.png)
.png)
.png)
.png)


.png)
.png)
.png)
.png)


.png)
.png)

.jpg)


.jpg)

.png)
.png)


.png)

_(annual_mean,_beginning_in_1659).png)