Category:Economic bar charts
Jump to navigation
Jump to search
Subcategories
This category has only the following subcategory.
G
Media in category "Economic bar charts"
The following 200 files are in this category, out of 258 total.
(previous page) (next page)-
 % DE DIFFERENCE DE SALAIRE ENTRE HOMME ET FEMME.jpg 597 × 290; 29 KB
-
 1 ipcc 5th report economic sector impact on environment en.svg 926 × 501; 114 KB
-
 1 диаграма.gif 381 × 189; 13 KB
-

-
 2 ipcc 5th report economic sector impact on environment ptbr.svg 926 × 501; 125 KB
-
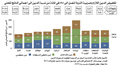
 2012年中央和地方预算执行情况与2013年中央和地方预算草案的报告 图1.jpg 500 × 315; 30 KB
-
 2012年中央和地方预算执行情况与2013年中央和地方预算草案的报告 图2.jpg 500 × 283; 31 KB
-
 2012年中央和地方预算执行情况与2013年中央和地方预算草案的报告 图3.jpg 500 × 339; 33 KB
-
 5年リース.png 349 × 194; 3 KB
-
 8年リース.png 349 × 194; 3 KB
-
 Absence rates and occupation 2005.png 401 × 238; 3 KB
-
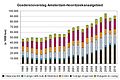 Amsterdam Havenoverslag1.jpg 1,800 × 1,200; 514 KB
-
 AnimaniA gesamte Druckauflage.svg 800 × 1,026; 63 KB
-
 Annual Crops of Cranberries, 1907 to 1935, American Cranberry Exchange.png 1,464 × 1,018; 1.28 MB
-
 Annual greenhouse gas emissions by sector, in 2010 (color).png 1,500 × 1,200; 111 KB
-
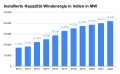 Ausbau der Windenergie in Indien in MW.svg 600 × 371; 166 KB
-
 Ausländische Direktinvestitionen in Deutschland 2009.jpg 1,043 × 600; 36 KB
-
 Ausländische Direktinvestitionen in Deutschland 2010 v2.jpg 669 × 352; 27 KB
-
 Ausländische Direktinvestitionen in Deutschland 2010.jpg 711 × 547; 57 KB
-
 Ausländische Direktinvestitionen in Deutschland 2011.jpg 469 × 258; 17 KB
-
 Ausländische Direktinvestitionen in Deutschland 2012.jpg 599 × 333; 29 KB
-
 Ausländische Direktinvestitionen in Deutschland 2013.jpg 987 × 574; 32 KB
-
 Ausländische Direktinvestitionen in Deutschland 2014.jpg 784 × 403; 36 KB
-
 Average annual family income growth, by income group, 1947-2016.png 908 × 773; 74 KB
-
 Average Effective Property tax of the 50 States (2007).jpg 671 × 478; 69 KB
-
 Average Effective Sales Tax of the 50 States (2007).gif 564 × 443; 63 KB
-
 Bar graph - economic statistics.jpg 1,084 × 459; 35 KB
-
 Bauvolumen 1991-1996.svg 603 × 421; 28 KB
-
 BBP 2002 0 40000.PNG 968 × 602; 26 KB
-
 BBP 2002 20000 40000.PNG 968 × 602; 24 KB
-
 BCG - Notwendige Schuldenreduktion.png 1,435 × 783; 153 KB
-
 BCG-necessary debt reduction-ar.png 1,452 × 798; 157 KB
-
 BCG-necessary debt reduction.png 1,452 × 798; 95 KB
-
 Bell telephone magazine (1922) (14569598829).jpg 1,334 × 2,040; 391 KB
-
 Bell telephone magazine (1922) (14569716990).jpg 1,474 × 866; 212 KB
-
 Bell telephone magazine (1922) (14569727270).jpg 1,400 × 772; 178 KB
-
 Bell telephone magazine (1922) (14569735949).jpg 1,336 × 788; 193 KB
-
 Bell telephone magazine (1922) (14569746149).jpg 1,592 × 834; 240 KB
-
 Bell telephone magazine (1922) (14569778538).jpg 1,274 × 2,246; 479 KB
-
 Bell telephone magazine (1922) (14569782319).jpg 1,370 × 1,228; 292 KB
-
 Bell telephone magazine (1922) (14570027007).jpg 1,288 × 1,308; 219 KB
-
 Bell telephone magazine (1922) (14753319671).jpg 1,344 × 2,084; 507 KB
-
 Bell telephone magazine (1922) (14756095052).jpg 1,190 × 2,014; 316 KB
-
 Bell telephone magazine (1922) (14756110252).jpg 1,372 × 834; 320 KB
-
 Bell telephone magazine (1922) (14756124932).jpg 1,370 × 714; 175 KB
-
 Bell telephone magazine (1922) (14756177442).jpg 1,370 × 952; 297 KB
-
 Bell telephone magazine (1922) (14776275983).jpg 1,390 × 850; 205 KB
-
 Bell telephone magazine (1922) (14776314853).jpg 1,328 × 2,026; 489 KB
-
 Biofuel manufacturers.jpg 660 × 570; 45 KB
-
 BNEVerteilung.PNG 961 × 596; 68 KB
-
 Branchen Transaktionsdruck.PNG 792 × 355; 23 KB
-
 Brookings -- 2030 Extreme Poverty Projections.png 900 × 602; 137 KB
-
 Bruttowertschöpfung 2007.svg 800 × 350; 45 KB
-
 BSPDRWeltkrise.PNG 970 × 603; 6 KB
-
 BSPDRWeltkriseEngl.PNG 970 × 603; 27 KB
-
 Buchwertverfahren.png 4,724 × 1,890; 547 KB
-
 Bulle 90 variation prix chart.svg 512 × 410; 22 KB
-

-
 Bundesarchiv Bild 183-62752-0001, Plaste.jpg 550 × 771; 48 KB
-

-
 CCI in India.JPG 898 × 332; 37 KB
-
 Chart on teams.jpg 1,323 × 950; 110 KB
-
 Chart Umsatz Einhell 2011-2021.jpg 931 × 584; 55 KB
-
 Climate change fig4 gdp per capita.png 1,675 × 578; 44 KB
-
 Climate change fig4 gross dometic product.png 1,671 × 582; 41 KB
-
 Climate change fig4 population.png 1,653 × 588; 65 KB
-
 Climate change fig5 emissions intensity.png 1,332 × 499; 52 KB
-
 Climate change fig5 emissions per capita.png 1,320 × 466; 34 KB
-
 Climate change fig5 total emissions.png 1,298 × 467; 59 KB
-
 Common cost and Avoidable cost ja.png 899 × 591; 13 KB
-
 Consumer Confidence Index.png 901 × 335; 17 KB
-
 Cotisations sociales OCDE.png 1,068 × 689; 31 KB
-
 Creditors of Greece-ar.png 1,038 × 770; 127 KB
-
 Creditors of Greece.png 1,038 × 770; 64 KB
-
 Cross subsidization test ja.png 957 × 782; 28 KB
-
 Data breach average cost germany.svg 500 × 750; 50 KB
-
 DDS 2019 mezinárodní srovnání.png 502 × 855; 85 KB
-
 Dds2019.png 1,096 × 706; 107 KB
-
 Dds2020.jpg 930 × 557; 53 KB
-
 Dettes souveraines 2011.jpg 600 × 560; 68 KB
-
 Bruttosozialprodukt im dt. Reich 1925-1939.svg 600 × 400; 31 KB
-
 Diagramm AnnuitätentilgungRestschuld.png 923 × 641; 30 KB
-
 Distribution of U.S. Federal Taxes 2000.JPG 539 × 330; 33 KB
-
 Dépenses militaires (2003-2005).png 580 × 463; 54 KB
-
 ECE weekly 235.png 537 × 535; 8 KB
-
 Economic sectors and income cn.JPG 745 × 548; 59 KB
-
 Economic sectors and income.JPG 745 × 548; 43 KB
-
 Economics of climate change chapter3 figure2.png 1,300 × 936; 44 KB
-
 Effective annual percentage rate.svg 342 × 264; 23 KB
-
 Erdölfördermenge pro Jahr (1965-2007).svg 419 × 295; 38 KB
-
 Erdölfördermenge pro Jahr (1970-2004).svg 310 × 235; 51 KB
-
 EURO-DANE Hiszpania bezrobocie.JPG 705 × 381; 38 KB
-
 EURO-DANE Niemcy Bezrobocie.JPG 705 × 381; 36 KB
-
 EURO-DANE PKB Austria.JPG 609 × 305; 24 KB
-
 EURO-DANE PKB Belgia.JPG 609 × 304; 23 KB
-
 EURO-DANE PKB Dania.JPG 609 × 304; 24 KB
-
 EURO-DANE PKB Francja.JPG 609 × 304; 24 KB
-
 EURO-DANE PKB Hiszpania.JPG 609 × 304; 25 KB
-
 EURO-DANE PKB Holandia.JPG 609 × 305; 24 KB
-
 EURO-DANE PKB Irlandia.JPG 609 × 304; 24 KB
-
 EURO-DANE PKB Niemcy.JPG 610 × 304; 24 KB
-
 EURO-DANE PKB Polska.JPG 609 × 308; 23 KB
-
 EURO-DANE PKB Szwecja.JPG 614 × 308; 23 KB
-
 EURO-DANE PKB Wielka Brytania.JPG 613 × 323; 25 KB
-
 EURO-DANE PKB Włochy.JPG 617 × 322; 24 KB
-
 EURO-DANE Polska Bezrobocie.JPG 705 × 381; 37 KB
-
 EURO-DANE Szwecja bezrobocie.JPG 705 × 381; 35 KB
-
 EURO-DANE Włochy bezrobocie.JPG 705 × 381; 35 KB
-
 EURODANE Wielka Brytania bezrobocie.JPG 705 × 381; 35 KB
-
 Evolucao ganhos corretoras mensalao.gif 682 × 446; 24 KB
-
 Expansão da cana de açucar.png 533 × 401; 87 KB
-
 Exportations 2007 en.svg 447 × 328; 62 KB
-
 Exportations 2007.svg 479 × 334; 67 KB
-
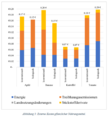 Externe kosten pflanzlich.png 554 × 607; 38 KB
-
 Externe kosten tierischer.png 577 × 615; 36 KB
-
 FAAMG Market Capitalization 2018 Sep 04.svg 1,280 × 720; 18 KB
-
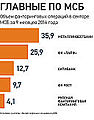 Factoring 2014.jpg 660 × 846; 81 KB
-
 Fdibycountry2008.jpg 468 × 313; 17 KB
-
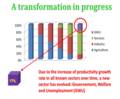 Fig. 3a. Sector dynamics in the US and unsustainability of GWU.PNG 744 × 612; 157 KB
-
 Figure01-earnings by degree.gif 720 × 371; 48 KB
-
 Fleischkonsum-Welt.png 3,000 × 1,600; 157 KB
-
 Foreign direct investments 2008 v1.jpg 467 × 262; 13 KB
-
 Foreign Direct Investments 2009.jpg 1,043 × 600; 34 KB
-
 Foreign Direct Investments Germany.jpg 468 × 297; 15 KB
-
 Foreign direct investments in Germany 2010 v2.jpg 679 × 361; 26 KB
-
 Foreign direct investments in Germany 2010.jpg 698 × 530; 50 KB
-
 Foreign direct investments in Germany 2011.jpg 470 × 257; 17 KB
-
 Foreign direct investments in Germany 2012.jpg 600 × 332; 25 KB
-
 Foreign direct investments in Germany 2013.jpg 1,100 × 574; 31 KB
-
 Foreign direct investments in Germany 2014.jpg 826 × 427; 34 KB
-
 Foreign-exchange-reserve.png 1,200 × 980; 144 KB
-
 Fotopm2.jpg 1,083 × 668; 80 KB
-
 Fotopm3.jpg 1,074 × 660; 74 KB
-
 Ganhos corretoras mensalao.gif 529 × 375; 10 KB
-
 GermanyUnemploymentRate.svg 990 × 630; 60 KB
-
 Global House Price Value.pdf 1,752 × 1,239; 138 KB
-
 Global-Graphene-Infused-Packaging-Market.png 656 × 302; 64 KB
-
 GNIdistributionFRG.png 961 × 596; 39 KB
-
 Grafhoritzontal01.jpg 550 × 298; 34 KB
-
 Grafico ebit.jpg 417 × 218; 23 KB
-
 Greenhouse Gas Emissions by Economic Sector-cs.svg 960 × 768; 14 KB
-
 Greenhouse Gas Emissions by Economic Sector.svg 960 × 768; 4 KB
-
-
 Grupos socioeconómicos en Santo Domingo según circunscripciones, 2002.png 1,056 × 608; 51 KB
-
 HanboroughStation 1998–2015.png 679 × 341; 23 KB
-
 HC - Figure 2.JPG 627 × 420; 28 KB
-
 Hedge funds and tax haven-fr.svg 654 × 632; 27 KB
-
 HoneybourneStation 1998–2015.png 680 × 341; 18 KB
-
 House price comparison - cost vs rent as percentage over or under-valued.pdf 1,752 × 1,239; 100 KB
-
 IISI TopSteel2005.png 871 × 626; 1.56 MB
-
 Income profession.png 421 × 302; 9 KB
-
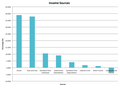 Income sources of St James Settlement.png 478 × 360; 25 KB
-
 Infrastructure Investment and Jobs Act Summary.png 1,322 × 717; 62 KB
-
 Ipcc 2014 bar graph.png 698 × 661; 26 KB
-
 IRWD Water Supply Portfolio.jpg 600 × 335; 72 KB
-
 IslandLine 1998–2015.png 681 × 341; 28 KB
-
 Knowledge bar graph.png 1,024 × 768; 452 KB
-
 Level of automation of individual HR processes in Russia.jpg 660 × 568; 75 KB
-
 Lohnminute2.png 1,209 × 952; 23 KB
-
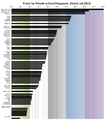 Metallpreise.png 1,150 × 1,307; 59 KB
-
 Minimum to Median Wage OECD 2016.png 464 × 653; 56 KB
-
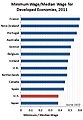 Minimum Wage Divided by Median Wage in OECD Countries 2011.jpg 325 × 469; 59 KB
-
 Monthly inflation in Argentina, 2002-notext.png 1,002 × 676; 22 KB
-
 Monthly inflation in Argentina, 2002.png 630 × 436; 3 KB
-

-

-
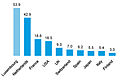
 Most traded export products-fa.png 1,531 × 697; 45 KB
-
 Nuova immagine (2).png 643 × 412; 70 KB
-
 Oecd-part-time-employees.svg 750 × 563; 123 KB
-
 Oil revenue by country.jpg 1,008 × 630; 61 KB
-
 Oil revenues by oil exporting country.jpg 617 × 481; 42 KB
-
 OxfordClockmakers.tif 3,021 × 1,846; 801 KB
-
 Pension capital in European countries.png 970 × 590; 26 KB
-
 PIB et recherche.GIF 328 × 249; 6 KB
-
 Piiggs balance sheet 2009.png 2,949 × 2,160; 96 KB
-
 Piiggs Debt 2014.png 625 × 501; 25 KB
-
 Planning start a business.jpg 660 × 403; 31 KB
-
 Podíl SME na počtu podniků EU.PNG 532 × 114; 4 KB
-
 Postwachstumsökonomie.png 960 × 720; 14 KB
-
 PotentialEnvironmentalExpenditureUK.JPG 563 × 349; 28 KB
-
 Prece perdas oper financeiras.gif 583 × 431; 11 KB
-
 Precio Si.png 434 × 326; 248 KB
-
 Preissteigerung 1970-1980.png 596 × 541; 22 KB
-
 Prijsontwikkeling euro95 nl.PNG 842 × 580; 27 KB
-
 Production of biofuels.jpg 660 × 398; 53 KB
-
 Produktivita práce.PNG 451 × 163; 5 KB
-
 ProfitAandO1911-1922.tif 472 × 251; 348 KB
-
 Průměrná hrubá mzda za měsíc.png 800 × 430; 41 KB
-
 Puerto-rico-consolidated-fund-2010-2013.png 1,228 × 960; 105 KB
-
 Puerto-rico-general-fund-2010-2013.png 1,228 × 960; 94 KB
-
 Puerto-rico-labor-force-seasonally-adjusted-2005-2013.png 1,070 × 760; 46 KB
-
 Puerto-rico-month-over-month-economic-activity-index-cy-2013.png 874 × 659; 27 KB
-

-
 Puerto-rico-payroll-employment-seasonally-adjusted-2005-2013.png 782 × 563; 35 KB
-
 Puerto-rico-payroll-employment-seasonally-adjusted-2013.png 836 × 650; 33 KB
-
 R&D Finland 2005.png 777 × 363; 33 KB
-
 Race 6 figure household and.png 424 × 304; 10 KB
-
 Reis Minuten.png 1,047 × 620; 13 KB
-
 Republicans Work to Protect Tax Breaks For Oil Companies (6815804058).jpg 1,064 × 782; 124 KB
-
 Retail Sales On The Rebound (4636378585).jpg 1,140 × 826; 172 KB


.png)


.jpg)
.gif)


_(14569598829).jpg)
_(14569716990).jpg)
_(14569727270).jpg)
_(14569735949).jpg)
_(14569746149).jpg)
_(14569778538).jpg)
_(14569782319).jpg)
_(14570027007).jpg)
_(14753319671).jpg)
_(14756095052).jpg)
_(14756110252).jpg)
_(14756124932).jpg)
_(14756177442).jpg)
_(14776275983).jpg)
_(14776314853).jpg)


.png)


.svg)
.svg)


.png)


.jpg)
.jpg)