Category:Election cartograms of Canada
Jump to navigation
Jump to search
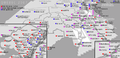
This category is for maps that represent federal and provincial election results riding by riding, i.e. using symbols of the same size in order to give a display representing seat distribution rather than geographical area held.
Media in category "Election cartograms of Canada"
The following 15 files are in this category, out of 15 total.
-
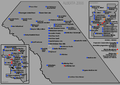 Alberta elections 2008.png 1,087 × 769; 162 KB
-
 Canada 2019 grid cartogram.png 10,800 × 5,400; 3.5 MB
-
 Canadian Federal Election Cartogram 2019.svg 1,782 × 814; 287 KB
-
 Canadian Federal Election Cartogram 2021.svg 1,782 × 814; 152 KB
-
 Canadian-Federal-2006.png 1,226 × 1,635; 93 KB
-
 Canadian-Federal-2008.png 1,226 × 1,635; 94 KB
-
 Cartogramme des élections fédérales canadiennes de 2021.svg 1,782 × 814; 287 KB
-
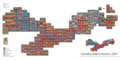
 Manitoba elections 2007.png 1,072 × 524; 113 KB
-
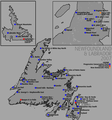 Nl elections 2007.png 870 × 929; 161 KB
-
 Tnl elections 2007.png 870 × 929; 160 KB
-
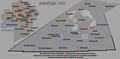
 Nwt elections 2007.png 1,050 × 742; 93 KB
-
 Tno elections 2007.png 1,050 × 742; 189 KB
-
 Ontario elections 2007.png 1,500 × 1,078; 268 KB
-
 Pei elections 2007.png 607 × 300; 48 KB
-
 Quebec elections 2007.png 1,000 × 483; 245 KB


