Category:GDP maps of Africa
Jump to navigation
Jump to search
Media in category "GDP maps of Africa"
The following 17 files are in this category, out of 17 total.
-
 15 poorest countries in 2013.svg 1,369 × 1,320; 210 KB
-
 Africa by GDP, 2002 (French).png 360 × 392; 13 KB
-
 Africa by GDP, 2002.png 360 × 392; 9 KB
-
 Africa GDP Map 2020.svg 1,000 × 1,000; 194 KB
-
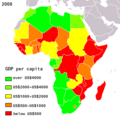 Africa GDP per capita 2008.png 360 × 360; 17 KB
-
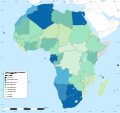
 Africa GDP per capita 2009.svg 1,000 × 1,000; 203 KB
-
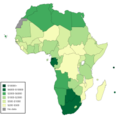
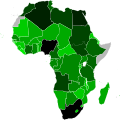 Africa-GDP.svg 1,000 × 1,000; 189 KB
-
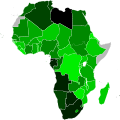 Africa-GDPpc.svg 1,000 × 1,000; 189 KB
-
 African countries by GDP (PPP) per capita in 2017.png 4,800 × 4,795; 1.39 MB
-
 African countries by GDP (PPP) per capita in 2020.png 4,800 × 4,795; 1.05 MB
-
 African countries by GDP (PPP) per capita in 2020.svg 1,430 × 1,350; 1.17 MB
-
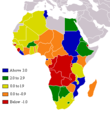 African gdp growth.png 360 × 392; 8 KB
-
 Arab-PPP 2007-2008.png 962 × 467; 25 KB
-
 Map of Africa by 2017 nominal GDP per capita (USD).png 4,800 × 4,795; 884 KB
-
 Map of Africa by 2020 nominal GDP per capita (USD).svg 1,000 × 1,000; 174 KB
-
 Nigerian States by estimated GDP, 2021.png 1,240 × 1,322; 301 KB
-
 Nigerian States by GDP, 2010.png 1,552 × 1,222; 597 KB

.png)


_per_capita_in_2017.png)
_per_capita_in_2020.png)
_per_capita_in_2020.svg)


.png)
.svg)

