Category:Global maps centered Greenwich
Jump to navigation
Jump to search
Media in category "Global maps centered Greenwich"
The following 172 files are in this category, out of 172 total.
-
 Meridiano de greenwich.jpg 1,600 × 835; 229 KB
-
 Primemeridian nolabels.jpg 1,600 × 833; 205 KB
-
 Primemeridian.jpg 1,600 × 835; 222 KB
-
 赤道、本初子午線及東亞部分都市位置圖.jpg 1,797 × 938; 357 KB
-
 1891 Telegraph Lines.jpg 956 × 600; 232 KB
-
 483897main Global-PM2.5-map.JPG 2,400 × 1,200; 1.32 MB
-
 Albers-equal-area-conic.png 673 × 346; 21 KB
-
 American Polyconic projection.jpg 2,058 × 1,580; 851 KB
-
 Azimuthal-equidistant.jpg 2,048 × 1,992; 984 KB
-
 Behrmann projection.png 800 × 369; 18 KB
-
 Blankmap-ao-000 -africa europe.xcf 726 × 726; 575 KB
-
 Blankmap-ao-090N-north pole.xcf 726 × 726; 773 KB
-
 Blankmap-ao-090S-south pole.xcf 726 × 726; 471 KB
-
 Blue Marble Next Generation + topography + bathymetry.jpg 3,600 × 1,800; 1.93 MB
-
 Bluemarble-Kavrayskiy-June.jpg 1,210 × 610; 429 KB
-
 Bluemarble-Kavrayskiy-Night.jpg 1,210 × 610; 451 KB
-
 Boggs eumorphic projection SW.JPG 2,070 × 1,042; 583 KB
-
 Bonne projection SW.jpg 2,058 × 1,955; 1.02 MB
-
 Bonne-projection.jpg 2,048 × 1,944; 1.14 MB
-
 Brockhaus and Efron Encyclopedic Dictionary b52 544-0.jpg 3,352 × 2,552; 1.72 MB
-
 Canters Polyconic Map.png 894 × 525; 523 KB
-
 Carte générale des grandes communications télégraphiques du monde.jpg 7,265 × 5,119; 34.73 MB
-
 Cassini projection SW.jpg 1,036 × 2,058; 668 KB
-
 Cassini-projection.jpg 1,027 × 2,048; 882 KB
-
 Cil-gnom.png 4,000 × 2,547; 650 KB
-
 Cil-stereo.png 4,000 × 2,547; 722 KB
-
 Connections between sister cities visualised on a world map (hotlog).svg 1,052 × 744; 29.84 MB
-
 Connections between sister cities visualised on a world map (jetlog).svg 1,052 × 744; 29.87 MB
-
 Craster parabolic projection SW.jpg 2,068 × 1,040; 576 KB
-
 Cyanocorax morio map.jpg 700 × 382; 97 KB
-
 Cyanocorax yncas2 map.jpg 700 × 382; 171 KB
-
 Desertification map-ar.jpg 1,700 × 1,100; 435 KB
-
 Desertification map.png 6,800 × 4,400; 1.04 MB
-
 Dist2con.png 3,600 × 1,800; 398 KB
-
 Division of the Earth into Gauss-Krueger zones - Globe.svg 948 × 948; 205 KB
-
 Earth Gravitational Model 1996-ru.png 742 × 468; 79 KB
-
 Earth Gravitational Model 1996.png 742 × 468; 34 KB
-
 Equidistante cilinder projectie 60NB ZB.PNG 517 × 517; 30 KB
-
 Equirectangular projection with grid only.svg 501 × 251; 65 KB
-
 Equirectangular-projection+terminator.jpg 2,048 × 1,025; 817 KB
-
 Equirectangular-projection-topographic-world.jpg 4,424 × 2,214; 1.66 MB
-
 Equirectangular-projection.jpg 2,048 × 1,025; 937 KB
-
 Flat earth.jpg 498 × 498; 31 KB
-
 Flat earth.png 543 × 543; 396 KB
-
 FPWorldMap Map.svg 3,000 × 1,700; 1.35 MB
-
 Gaa global amphib diversity.jpg 781 × 425; 179 KB
-
 Global gt3.gif 731 × 554; 23 KB
-
 Global patterns of terrestrial vertebrate diversity - journal.pbio.1001294.g001.png 2,049 × 880; 1.25 MB
-
 Hammer-Aitov Projection.jpg 4,096 × 2,048; 1.79 MB
-
 Hann Atlas der Meteorologie 11.jpg 1,180 × 962; 371 KB
-
 Hann Atlas der Meteorologie 2.jpg 1,180 × 975; 367 KB
-
 Hann Atlas der Meteorologie 3.jpg 1,180 × 975; 346 KB
-
 IGRF 2000 magnetic declination.gif 1,010 × 804; 66 KB
-
 ITunes Store availability December 13th 2011.png 990 × 617; 334 KB
-
 Kavrayskiy-vii-projection.jpg 2,048 × 1,182; 940 KB
-
 LA2-Blitz-0103.jpg 2,832 × 1,832; 1.39 MB
-
 Littrow projection SW.JPG 2,058 × 1,782; 1.06 MB
-
 Longitudes for Iran GEO satellites in 1970s.png 1,000 × 495; 195 KB
-
 Magnetic Field Earth.png 568 × 291; 308 KB
-
 Main geographical lines of the Earth.png 2,684 × 1,071; 111 KB
-
 McBryde-Thomas flat-pole quartic projection SW.jpg 2,068 × 938; 571 KB
-
 MCD12C1 A2002001 051 2014274184219 LCT-1.png 7,200 × 3,600; 939 KB
-
 MCD12C1 A2003001 051 2012264185451 LCT-1.png 7,200 × 3,600; 920 KB
-
 MCD12C1 A2004001 051 2012264185523 LCT-1.png 7,200 × 3,600; 924 KB
-
 MCD12C1 A2005001 051 2013164180706 LCT-1.png 7,200 × 3,600; 930 KB
-
 MCD12C1 A2006001 051 2013164180709 LCT-1.png 7,200 × 3,600; 924 KB
-
 MCD12C1 A2007001 051 2012264190141 LCT-1.png 7,200 × 3,600; 919 KB
-
 MCD12C1 A2008001 051 2012283145256 LCT-1.png 7,200 × 3,600; 910 KB
-
 MCD12C1 A2009001 051 2013164180520 LCT-1.png 7,200 × 3,600; 911 KB
-
 MCD12C1 A2010001 051 2012264191019 LCT-1.png 7,200 × 3,600; 905 KB
-
 MCD12C1 A2011001 051 2012264191639 LCT-1.png 7,200 × 3,600; 903 KB
-
 MCD12C1 A2012001 051 2013178154403 LCT-1.png 7,200 × 3,600; 883 KB
-
 MCD43B4.A2009153.mosaic.png 2,160 × 1,080; 2.27 MB
-
 MCD43C4 A2013169 005 2013191204312 band-1.jpeg 7,200 × 3,600; 1.83 MB
-
 Mercator grid.png 532 × 385; 58 KB
-
 Mercator Projection.svg 1,652 × 1,221; 276 KB
-
 Mercator-proj.jpg 679 × 724; 434 KB
-
 Mercator-projection.jpg 2,048 × 1,588; 1.33 MB
-
 MercNormSph enhanced.png 800 × 797; 660 KB
-
 MercNormSph.png 800 × 797; 806 KB
-
 Meyers b19 s0634a.jpg 3,406 × 2,668; 6.45 MB
-
 Meyers b4 s0489a.jpg 2,048 × 1,667; 839 KB
-
 Meyers b5 s0742a.jpg 2,048 × 1,647; 615 KB
-
 Meyers b9 s0954a.jpg 1,589 × 2,048; 504 KB
-
 Miller projection SW.jpg 2,058 × 1,512; 831 KB
-
 Miller-projection.jpg 2,048 × 1,502; 1.26 MB
-
 Mobildekning.JPG 800 × 369; 77 KB
-
 Mobildekning01.JPG 800 × 369; 80 KB
-
 MODIS temperature map.jpg 720 × 398; 53 KB
-
 Mollweide Projection.jpg 4,096 × 2,048; 1.76 MB
-
 Mollweide-projection.jpg 2,048 × 1,025; 766 KB
-
 Mollweide.jpg 10,800 × 5,400; 4.52 MB
-
 MYD13C1 A2013201 005 2013218212020 NDVI.jpeg 7,200 × 3,600; 1.8 MB
-
 Normal Mercator map 85deg.jpg 2,400 × 2,400; 915 KB
-
 Ortelius oval projection SW.JPG 2,070 × 1,042; 667 KB
-
 PDOP current values.gif 880 × 550; 64 KB
-
 Perlshaper orthographic example1.svg 550 × 550; 247 KB
-
 Perlshaper Winkel-Tripel example1.svg 1,100 × 700; 410 KB
-
 Polyconic-projection.jpg 2,048 × 1,569; 928 KB
-
 Present and future worldwide Köppen-Geiger climate-zone classification maps.png 2,133 × 2,695; 2.62 MB
-
 Prime meridian (HU).jpg 1,600 × 833; 154 KB
-
 Quartic authalic projection SW.jpg 2,068 × 938; 541 KB
-
 Rectangular polyconic projection SW.jpg 2,068 × 1,256; 765 KB
-
 Relief World Map by maps-for-free.jpg 16,384 × 12,544; 39.4 MB
-
 Robinson world.png 7,510 × 3,760; 18.9 MB
-
 Robinson-projection.jpg 2,048 × 1,039; 849 KB
-
 RobinsonWeltkarte (without background).png 10,800 × 5,478; 26.14 MB
-
 RobinsonWeltkarte.jpg 10,800 × 5,478; 4.83 MB
-
 Sinusoid-projection.jpg 2,048 × 1,024; 668 KB
-
 Sinusoidal Projection 0.jpg 4,096 × 2,048; 1.46 MB
-
 Sinusoïdale projectie.PNG 953 × 477; 46 KB
-
 SMAP Global Map of Surface Soil Moisture, 25-27 August 2015 (PIA19877).png 7,592 × 3,775; 1.9 MB
-
 Stielers Handatlas 1891 05.jpg 4,999 × 4,200; 5.1 MB
-
 The Times projection SW.jpg 2,068 × 1,512; 843 KB
-
 Tissot indicatrix world map Balthasart equal-area proj.svg 3,000 × 2,311; 1.06 MB
-
 Tissot indicatrix world map Behrmann equal-area proj.svg 3,000 × 1,271; 1,017 KB
-
 Tissot indicatrix world map equirectangular proj.svg 3,000 × 1,500; 1.44 MB
-
 Tissot indicatrix world map Gall-Peters equal-area proj.svg 3,000 × 1,906; 1.13 MB
-
 Tissot indicatrix world map Hobo-Dyer equal-area proj.svg 3,000 × 1,514; 1.14 MB
-
 Tissot indicatrix world map Kavrayskiy VII proj.jpg 1,000 × 578; 80 KB
-
 Tissot indicatrix world map Mercator proj.svg 3,000 × 2,984; 550 KB
-
 Tissot indicatrix world map Mollweide proj.svg 3,000 × 1,500; 1.53 MB
-
 Tissot indicatrix world map sinusoidal proj.svg 3,000 × 1,500; 1.51 MB
-
 Tissot indicatrix world map Smyth-Craster equal-area proj.svg 3,000 × 1,500; 1.07 MB
-
 Tissot indicatrix world map Tobler equal-area proj.svg 3,000 × 3,000; 1.06 MB
-
 Tissot indicatrix world map Trystan Edwards equal-area proj.svg 3,000 × 1,513; 1.07 MB
-
 Tissot indicatrix world map unnamed 40 deg equal-area proj.svg 3,000 × 1,627; 1.06 MB
-
 TropicalRains.png 2,000 × 1,042; 67 KB
-
 Un weltkarte.png 2,000 × 1,117; 1.47 MB
-
 USGS world oil endowment.png 1,047 × 551; 33 KB
-
 Utm-zones.jpg 2,048 × 1,024; 821 KB
-
 VAAC Coverage.jpg 3,600 × 2,475; 1.76 MB
-
 Van der Grinten projection 118.png 118 × 118; 13 KB
-
 Van der grinten projection of Earth.jpg 2,048 × 1,024; 582 KB
-
 Van der Grinten projection SW.jpg 2,058 × 2,058; 1.05 MB
-
 Van-der-Grinten-I-projection.jpg 2,048 × 1,456; 1.14 MB
-
 Voorbeeld mercator projectie.png 563 × 519; 34 KB
-
 Wagner-vi-projection.jpg 2,048 × 1,024; 845 KB
-
 Web maps Mercator projection SW.jpg 2,068 × 2,060; 1.1 MB
-
 Weltkarte Edelstein Abbau.png 2,000 × 1,086; 1.31 MB
-
 Weltkarte unkonventionelle Öl- u. Gaslagerstätten.png 2,000 × 1,085; 1.3 MB
-
 Weltkarte-Bergbau.png 4,779 × 2,594; 5.36 MB
-
 Weltkarte-Braunkohle-Förderung.png 2,000 × 1,086; 1.31 MB
-
 Weltkarte-Buntmetalle-Förderung.png 2,000 × 1,086; 1.32 MB
-
 Weltkarte-Edelmetall-Förderung.png 2,000 × 1,086; 1.32 MB
-
 Weltkarte-Eisenförderung.png 2,000 × 1,086; 1.32 MB
-
 Weltkarte-Förderung-Salze.png 2,000 × 1,086; 1.31 MB
-
 Weltkarte-Leichtmetall-Förderung.png 2,000 × 1,086; 1.31 MB
-
 Weltkarte-Steinkohle-Förderung.png 2,000 × 1,086; 1.32 MB
-
 Weltkarte-Uranförderung.png 2,000 × 1,086; 1.32 MB
-
 Wereld niet geprojecteerd.PNG 621 × 315; 23 KB
-
 Wereld robinson.PNG 1,034 × 528; 54 KB
-
 Werner projection SW.jpg 2,058 × 2,065; 1.11 MB
-
 Where the pound is used.jpg 804 × 584; 152 KB
-
 Winkel-tripel-projection.jpg 2,048 × 1,252; 940 KB
-
 Winkeltripel.jpg 10,800 × 6,599; 5.42 MB
-
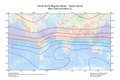
 WMM2010 F MERC.jpg 3,254 × 2,176; 3.24 MB
-
 WMM2010 F MERC.pdf 5,400 × 3,600; 866 KB
-
 WMO-squares-global.gif 1,234 × 660; 248 KB
-
 Woodbridge isothermal chart.jpg 3,360 × 2,636; 4.57 MB
-
 Woodbridge isothermal chart2.jpg 3,357 × 2,628; 6.24 MB
-
 Woodbridge isothermal chart3.jpg 3,338 × 2,413; 6.24 MB
-
 World borders robinson.png 2,000 × 1,000; 324 KB
-
 World cyclopedia 1820.jpg 3,149 × 1,990; 990 KB
-
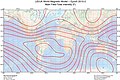
 World Magnetic Declination 2010.pdf 5,400 × 3,600; 865 KB
-
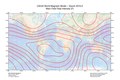
 World Magnetic Inclination 2010.pdf 5,400 × 3,600; 828 KB
-
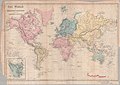 World Map 1855.jpg 6,701 × 4,763; 2.74 MB
-
 World Map by Daniel Lizars (1831?).png 8,600 × 5,823; 95.51 MB
-
 World Map Hammer.svg 751 × 375; 200 KB
-
 World map sinusoidal proj-0deg centered.svg 3,000 × 1,500; 1.46 MB
-
 World Map using Aitoff Projection.svg 751 × 376; 208 KB
-
 Океани Землі.png 2,058 × 2,058; 4.67 MB


.svg)
.svg)


.jpg)


.png)


.png)


.png)


