Category:HDI maps of the world
Jump to navigation
Jump to search
Media in category "HDI maps of the world"
The following 108 files are in this category, out of 108 total.
-
 2010 Human Development Report.png 1,350 × 652; 55 KB
-
 2010 UN Human Development Report Quartiles.png 1,350 × 652; 87 KB
-
 2010 UN Human Development Report.png 1,350 × 652; 88 KB
-
 2010 UNDP Human Development Report Quartiles -2.png 1,350 × 652; 80 KB
-
 2010 UNDP Human Development Report Quartiles.png 1,350 × 652; 65 KB
-
 2011 UN Human Development Report Quartiles.svg 940 × 415; 1.45 MB
-
 2013 UN Human Development Report Quartiles.svg 863 × 375; 1.38 MB
-
 2014 UN Human Development Report Quartiles.svg 863 × 375; 1.36 MB
-
 2015 UN Human Development Report Quartiles 2.png 1,417 × 637; 40 KB
-
 2015 UN Human Development Report Quartiles.png 1,417 × 637; 49 KB
-
 2016 UN Human Development Report (Quartiles).svg 921 × 400; 1.4 MB
-
 2016 UN Human Development Report Quartiles.png 3,596 × 1,563; 623 KB
-
 2016 UN Human Development Report.svg 921 × 404; 1.47 MB
-
 2017 UN Human Development Report Quartiles.svg 863 × 375; 1.36 MB
-
 2017-2018 HDI Increases and Decreases.svg 2,631 × 1,164; 1.4 MB
-
 2018 HDI.svg 2,803 × 1,333; 2.65 MB
-
 2018 Inequality-Adjusted Human Development INdex.svg 2,825 × 1,239; 1.39 MB
-
 2018 UN HDI Report Map.png 1,173 × 510; 124 KB
-
 2018 UN Human Development Report (inequality-adjusted).svg 512 × 230; 767 KB
-
 2018 UN Human Development Report.svg 512 × 230; 767 KB
-
 2019 UN Human Development Report (inequality-adjusted).svg 512 × 230; 810 KB
-
 2019 UN Human Development Report.svg 512 × 230; 799 KB
-
 2020 Inequality-Adjusted Human Development Index Map.png 9,731 × 4,377; 2.86 MB
-
 2020 Inequality-Adjusted Human Development Index.svg 512 × 230; 862 KB
-
 2020 UN Human Development Report (inequality-adjusted).svg 2,192 × 1,135; 1.62 MB
-
 2020 UN Human Development Report (Old Colors).svg 512 × 230; 767 KB
-
 2020 UN Human Development Report.svg 2,192 × 1,135; 1.62 MB
-
 2021 UN Human Development Report.png 430 × 193; 42 KB
-
 2021-22 UN Human Development Report (inequality-adjusted).svg 2,192 × 1,135; 1.64 MB
-
 2021-22 UN Human Development Report (multicolor).svg 2,192 × 1,135; 1.64 MB
-
 2021-22 UN Human Development Report.svg 2,192 × 1,135; 1.64 MB
-
 2022-24 UN Human Development Report (inequality-adjusted).svg 2,192 × 1,135; 1.65 MB
-
 2024 Inequality-Adjusted Human Development Index.svg 2,192 × 1,135; 1.65 MB
-
 800pix-HDImap2007.jpg 800 × 370; 157 KB
-
 Average annual HDI growth (2010-2019).svg 2,911 × 1,297; 2.09 MB
-
 Changes in HDI values from 2018 to 2019 report.png 6,101 × 2,710; 1.87 MB
-
 Countries by Human Development Index (2018).png 6,054 × 2,690; 1.47 MB
-
 Countries by Human Development Index (2018).svg 2,754 × 1,398; 1.06 MB
-
 Countries by Human Development Index (2019), score changes.svg 2,911 × 1,297; 2.09 MB
-
 Countries by Human Development Index (2019).png 6,060 × 2,737; 1.49 MB
-
 Countries by Human Development Index (2019).svg 2,192 × 1,135; 1.63 MB
-
 Countries by Human Development Index (2020).png 6,915 × 3,087; 2.11 MB
-
 Countries by Human Development Index (2021) 2.png 6,915 × 3,087; 1.6 MB
-
 Countries by Human Development Index (2021).svg 2,192 × 1,135; 1.64 MB
-
 Countries by Human Development Index category (2020).png 6,936 × 3,087; 2.17 MB
-
 Countries by inequality-adjusted Human Development Index (2019).png 6,110 × 2,748; 1.79 MB
-

-
 Countries with Very High HDI in the 2019 Human Development Index Report.svg 2,192 × 1,135; 1.64 MB
-
 Derdewereld.png 1,357 × 628; 28 KB
-
 Desarrrollados.png 1,352 × 630; 46 KB
-
 HDI 2006 Results Standardized Coloring Scheme.png 1,357 × 617; 30 KB
-
 HDI 2006 Results.png 1,357 × 617; 30 KB
-
 HDI 2018 (updated).svg 1,003 × 438; 1.41 MB
-
 HDI Improvements 2.svg 2,631 × 1,164; 1.42 MB
-
 HDI Improvements.svg 2,631 × 1,164; 1.42 MB
-
 HDI Most Recent Results for each State and Territory.png 1,357 × 617; 30 KB
-
 HDI world 2005.svg 950 × 620; 279 KB
-
 HDI.png 1,350 × 652; 58 KB
-
 Hdi2011.png 2,804 × 1,766; 135 KB
-
 Hdi2011colorsave.png 2,804 × 1,766; 134 KB
-
 Hdi2011eng.png 2,804 × 1,766; 136 KB
-
 HDImap 2005.png 1,357 × 628; 32 KB
-
 HDImap current.png 1,350 × 625; 45 KB
-
 HDImap spectrum2006-colourblind-compliant.png 1,350 × 625; 21 KB
-
 HDImap spectrum2006.png 1,350 × 625; 20 KB
-
 HDImap.PNG 1,357 × 628; 39 KB
-
 HDImap2006-colourblind-compliant.png 1,357 × 628; 29 KB
-
 HDImap2006.png 1,357 × 628; 47 KB
-
 HDImap2007.png 1,357 × 628; 27 KB
-
 HDImap2008-2007.png 1,350 × 625; 131 KB
-
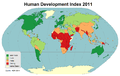
 Human Development Index 2011.PNG 2,069 × 815; 178 KB
-
 IDH 2011.png 1,350 × 652; 50 KB
-
 IDH 20111.png 1,350 × 652; 50 KB
-
 IDH-2010.PNG 1,350 × 652; 49 KB
-
 IDH-2011.jpg 1,425 × 631; 245 KB
-
 IDH-2011.png 1,357 × 631; 34 KB
-
 Indice de développement humain (2012) v3.jpg 994 × 403; 65 KB
-
 Indice Sviluppo Umano.png 1,357 × 628; 37 KB
-
 Indice Sviluppo Umano2018.png 1,357 × 628; 37 KB
-
 Inequality-adjusted Human Development Index 2014.svg 863 × 379; 1.36 MB
-
 Inequality-adjusted Human Development Index.png 1,425 × 625; 36 KB
-
 Inequality-adjusted human development index.svg 1,035 × 531; 1.47 MB
-
 IQAHDI 2018.svg 1,003 × 435; 1.42 MB
-
 Mapa Mundial, IDH ajustado por desigualdad 2012.PNG 1,117 × 447; 68 KB
-
-
 Países desenvolvidos de acordo com o FMI em 2017.svg 2,560 × 1,314; 1.13 MB
-
 UN HDI 2011 North South.svg 940 × 415; 1.45 MB
-
 UN Human Development Report 2007 (1) CBC.png 1,350 × 625; 49 KB
-
 UN Human Development Report 2007 (1).png 1,350 × 625; 19 KB
-
 UN Human Development Report 2007 (2) CBC.png 1,350 × 625; 51 KB
-
 UN Human Development Report 2007 (2).png 1,350 × 625; 51 KB
-
 UN Human Development Report 2008.png 1,350 × 652; 50 KB
-
 UN Human Development Report 2008.svg 940 × 415; 1.6 MB
-
 UN Human Development Report 2009.PNG 1,350 × 652; 50 KB
-
 UN Human Development Report 2010 1.PNG 1,350 × 652; 57 KB
-
 UN Human Development Report 2010.PNG 1,350 × 652; 49 KB
-
 UN Human Development Report 2011.svg 940 × 415; 1.45 MB
-
 UN Human Development Report 2013.svg 863 × 379; 1.37 MB
-
 UN Human Development Report 2014.svg 863 × 379; 1.38 MB
-
 UN Human Development Report 2015 2.png 1,417 × 637; 42 KB
-
 UN Human Development Report 2015.png 1,417 × 637; 51 KB
-
 UN Human Development Report 2015.svg 863 × 379; 1.36 MB
-
 Vietnam HDI map (by province).svg 512 × 1,024; 281 KB
-
 World literacy map UNHD 2007 2008.png 1,350 × 625; 60 KB
-
 World map by 2010 Human Development Index.png 5,040 × 2,431; 303 KB
-
 World Map of Subnational HDI.jpg 10,667 × 5,475; 5.94 MB
-
 Worldmap-hdi2004-legende.png 250 × 286; 2 KB
-
 Worldmap-hdi2004.png 1,357 × 628; 19 KB


.svg)


.svg)

.svg)


.svg)
.svg)


.svg)
.svg)

.svg)


.svg)

.png)
.svg)
,_score_changes.svg)
.png)
.svg)
.png)
_2.png)
.svg)
.png)
.png)


.svg)


.png)


_CBC.png)
.png)
_CBC.png)
.png)


.svg)


_v3.jpg)