Category:Industry diagrams
Jump to navigation
Jump to search
Subcategories
This category has the following 7 subcategories, out of 7 total.
Media in category "Industry diagrams"
The following 62 files are in this category, out of 62 total.
-
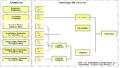
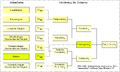
 1942 Illustratie De organisatie van de Nederlandsche industrie.jpg 2,881 × 2,631; 1.83 MB
-
 Ablaufarten Arbeitsgegenstand.svg 886 × 668; 23 KB
-
 Ambiente Simbiótico Industrial.png 640 × 384; 115 KB
-
 ARBdrugdevelopment.jpg 1,364 × 1,772; 162 KB
-
 Arbeitsbeschreibungsbogen.jpg 576 × 624; 115 KB
-
 Arbeitsbeschreibungsbogen.svg 587 × 639; 20 KB
-
 Berechnungsformel der Bürokratiebelastung.JPG 934 × 365; 36 KB
-
 BIPBRD5004.svg 800 × 550; 49 KB
-
 Bruttoinlandsprodukt DE.svg 723 × 578; 17 KB
-
 Ciclo produttivo.png 946 × 506; 192 KB
-
 Code propriété intellectuelle Fr.jpg 768 × 1,181; 295 KB
-
 Countries by industrial output.PNG 1,559 × 649; 39 KB
-
 Demand chain medium.png 665 × 455; 71 KB
-
 Diagrama de Ishikawa o de causa efecto del descubrimiento de América.png 2,702 × 2,034; 322 KB
-
 Diagrama-general-de-causa-efecto.svg 491 × 291; 28 KB
-
 Eco echelle.png 1,570 × 1,336; 60 KB
-
 Employment by Industry in the US-2007.png 906 × 664; 33 KB
-
 ESQUEMA PROCESADO SEMISOL.jpg 1,212 × 638; 201 KB
-
 Europe bitume consumption.png 680 × 520; 24 KB
-
 Europe bitume consumption.svg 680 × 520; 177 KB
-
 Export import pollution.svg 622 × 297; 9 KB
-
 Father Hagerty's Wheel of Fortune, 1905.jpg 800 × 792; 212 KB
-
 -01 ITALY Fiat Punto Modelli piu linea Maps.png 2,212 × 1,592; 127 KB
-
 Fibers Classification.jpg 960 × 720; 53 KB
-
 Humpolec, pivovar Bernard (27).jpg 5,184 × 3,456; 6.28 MB
-
 Humpolec, pivovar Bernard (28).jpg 5,184 × 3,456; 6.49 MB
-
 Humpolec, pivovar Bernard (29).jpg 3,456 × 5,184; 6.43 MB
-
 Humpolec, pivovar Bernard (30).jpg 3,456 × 5,184; 5.95 MB
-
 Humpolec, pivovar Bernard (31).jpg 5,184 × 3,456; 6.4 MB
-
 Humpolec, pivovar Bernard (32).jpg 5,184 × 3,456; 6.56 MB
-
 Humpolec, pivovar Bernard (33).jpg 5,184 × 3,456; 6.39 MB
-
 Humpolec, pivovar Bernard (40).jpg 5,184 × 3,456; 4.92 MB
-
 Industria mundo.png 1,357 × 628; 113 KB
-
 Instances-CECA.svg 983 × 695; 9 KB
-
 Mappa stabilimento.gif 737 × 489; 71 KB
-
 Modele mulhousien.png 1,123 × 794; 195 KB
-
 Modele mulhousien.svg 512 × 362; 104 KB
-
 Nave Industrial 3D.GIF 726 × 448; 31 KB
-
 OECD-Wirtschaftsdaten.png 814 × 561; 53 KB
-
 Percent in agriculture - US.png 817 × 445; 56 KB
-
 ProcédéDeFabrication.jpg 450 × 166; 10 KB
-
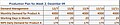 ProductionPlan.jpg 755 × 157; 28 KB
-
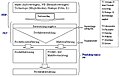 Produktentstehungsprozess.jpg 601 × 387; 51 KB
-
 Q de Tobin.png 440 × 284; 46 KB
-
 RACI.png 512 × 345; 9 KB
-
 RelativerLohn.svg 911 × 692; 15 KB
-
 Schemat blokowy.png 758 × 612; 48 KB
-
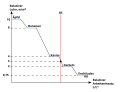
 Shifting production function small.png 395 × 326; 9 KB
-
 Shifting production function small.svg 395 × 326; 3 KB
-
 Slide rule for turning work.png 2,044 × 785; 1.02 MB
-
 Stages of production small.png 349 × 506; 12 KB
-
 Stages of production small.svg 349 × 506; 3 KB
-
 Subjektive Tätigkeitsanalyse.jpg 398 × 654; 90 KB
-
 Value Demand v small.png 621 × 182; 53 KB
-
 Verteilung der Weltbevölkerung nach Subsistenztätigkeit.png 1,335 × 908; 97 KB
-
 Vorgabezeit B.png 777 × 463; 20 KB
-
 Vorgabezeit MB.png 788 × 448; 22 KB
-
 Vorgabezeit.png 777 × 463; 20 KB
-
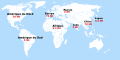
 Weltmarkt Windkraftanlagenhersteller 2010.png 823 × 579; 73 KB
-
 Wirtschaftseinheiten Betriebe.svg 668 × 263; 7 KB
-
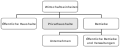 Wirtschaftseinheiten Privathaushalte.svg 668 × 263; 7 KB
-
 World bitume consumption.svg 4,500 × 2,234; 2.96 MB


.jpg)
.jpg)
.jpg)
.jpg)
.jpg)
.jpg)
.jpg)
.jpg)


