Category:Maps showing 2019
Jump to navigation
Jump to search
| ← 2010 2011 2012 2013 2014 2015 2016 2017 2018 2019→ |
English: Maps showing the year 2019 (i.e. history maps)
See also category: 2019 maps. and 2010s maps for old maps created in this time.
See also category: 2019 maps. and 2010s maps for old maps created in this time.
Subcategories
This category has the following 4 subcategories, out of 4 total.
E
- 2019 Ebola outbreak maps (4 F)
- ECHO Daily Maps of 2019 (242 F)
- ECHO Situation Maps of 2019 (11 F)
U
Media in category "Maps showing 2019"
The following 13 files are in this category, out of 13 total.
-
 Average height of female 19-year-olds by country in 2019.svg 2,754 × 1,398; 1.45 MB
-
 Average height of male 19-year-olds by country in 2019.svg 2,754 × 1,398; 1.45 MB
-
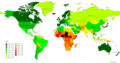
 Child mortality map of the world 2019.svg 863 × 443; 1.69 MB
-
 Countries by GDP (nominal) per capita in 2019.svg 2,911 × 1,297; 2.08 MB
-
 Countries by Human Development Index (2019).svg 2,192 × 1,135; 1.63 MB
-
Evolution of United States standard time zone boundaries.webm 29 s, 3,507 × 2,480; 4.58 MB
-
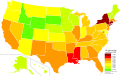 Gini United States by state 2019.svg 512 × 324; 204 KB
-
 Life expectancy map -world -2019 -with names.png 6,460 × 3,403; 2.02 MB
-
 Life expectancy map -world -2019.png 6,460 × 3,403; 1.66 MB
-
 Life expectancy map v2 -world -2019.png 6,460 × 3,403; 1.66 MB
-
 Metric and imperial systems (2019).svg 2,754 × 1,398; 1.07 MB
-

-
 Singulate mean age at marriage, difference world 2019.svg 2,754 × 1,398; 1.05 MB


_per_capita_in_2019.svg)
.svg)


.svg)
_world_map_in_2019(WHO).png)
