Category:Mortality rates
Vai alla navigazione
Vai alla ricerca
rapporto dei morti in una località  | |||||
| Carica un file multimediale | |||||
| Istanza di |
| ||||
|---|---|---|---|---|---|
| Sottoclasse di |
| ||||
| Distinto da | |||||
| |||||
Sottocategorie
Questa categoria contiene le 5 sottocategorie indicate di seguito, su un totale di 5.
C
I
M
File nella categoria "Mortality rates"
Questa categoria contiene 37 file, indicati di seguito, su un totale di 37.
-
02. Стапка на смртност во Македонија во 2021 година.ogv 1 min 29 s, 1 920 × 1 080; 52,32 MB
-
 2016GunDeathsCDC.png 1 143 × 800; 257 KB
-
 Altersspezifische Sterberaten Deutschland.svg 540 × 360; 143 KB
-
-
 Bellamy 2.PNG 490 × 504; 21 KB
-
 Bellamy 3.PNG 573 × 300; 18 KB
-
 Bellamy.PNG 971 × 524; 74 KB
-
 Births Deaths Population Netherlands 1805-2022.png 4 647 × 4 272; 574 KB
-
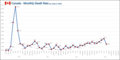 Canada - Monthly Death Rate (Jul 14, 2023).png 1 577 × 786; 101 KB
-
 CfMortalidadeInfantil.jpg 729 × 617; 79 KB
-
 Chart of Mortality, Great Plague in London Wellcome L0025769.jpg 1 750 × 1 164; 745 KB
-
 Current UK Excess Deaths w.ADDED lines to show Baseline Shift.png 602 × 307; 118 KB
-
 Death rate world map CIA 2009.PNG 1 455 × 630; 41 KB
-
 Diagramma.jpg 800 × 743; 182 KB
-
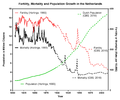 Fertility mortality and population growth in the Netherlands.png 2 376 × 1 980; 237 KB
-
 Force de mortalité en France en 2010.svg 630 × 630; 88 KB
-
 Geboortes sterfte en inwoners Nederland 1807-2018.png 4 749 × 4 272; 570 KB
-
 Geboortes sterfte inwoners Nederland 1807-2015.png 4 749 × 3 960; 518 KB
-
 Journal.pone.0008401.g004.png 2 372 × 1 155; 351 KB
-
 Mortality in different parts of metropolis. Wellcome L0001743.jpg 1 354 × 1 390; 684 KB
-

-
 Nauru life-expectancy-childrens-death-rate fr.svg 841 × 671; 61 KB
-
 Nauru life-expectancy-death-rate fr.svg 855 × 646; 71 KB
-

-

-
 Road-mortality-rate-comparison.png 3 400 × 2 400; 594 KB
-
 Rodové rozdíly v dožití.jpg 1 015 × 782; 80 KB
-
 Suicidio wiki.png 578 × 521; 12 KB
-

-
 Tasso di letalità Covid-01.svg 512 × 384; 6 KB
-
 Trends in pregnancy-related mortality in the United States 1987-2012.png 1 280 × 960; 466 KB
-
 VariazionePesoMortalitàW.png 685 × 345; 260 KB
-
 Verona tabella tasso di mortalità anni 1997 - 2011.pdf 1 754 × 1 239; 75 KB
-
 WomenBMIMort.png 641 × 493; 19 KB
-
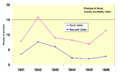 Yearly mortality rates 1841-1846 two clinics.png 1 236 × 764; 12 KB
-
 Yearly mortality rates 1841-1846 two clinics.svg 890 × 550; 100 KB
-
 Youth Mortality, 2000.png 1 456 × 1 076; 301 KB


.png)


