Category:Reliability
Jump to navigation
Jump to search
Subcategories
This category has the following 3 subcategories, out of 3 total.
Media in category "Reliability"
The following 44 files are in this category, out of 44 total.
-
 Badewannenkurve.png 371 × 311; 1 KB
-
 Bathtub curve de.svg 1,236 × 873; 12 KB
-
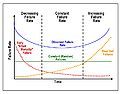 Bathtub curve.jpg 6,150 × 4,800; 859 KB
-
 Brand Quality in 2010 by Average of Overall Reliability.png 358 × 577; 14 KB
-
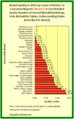 Brand Quality in 2010 by Infrequency of Trouble-Prone Models.png 358 × 578; 15 KB
-

-
 Content mapping for GBI parcels onto the 7 Up-7 Down scales.png 1,592 × 1,424; 114 KB
-
 Content mapping for GBI parcels--10 item Mania and Depression forms.png 1,672 × 1,414; 163 KB
-
 Courbe contrainte durée de vie.svg 325 × 239; 11 KB
-
 Courbe survie locotracteurs actuarielle.svg 503 × 398; 48 KB
-
 Courbe survie locotracteurs Kaplan Meier.svg 503 × 398; 49 KB
-
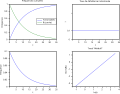 Courbes fiabilite exponentielle 01.svg 584 × 455; 86 KB
-
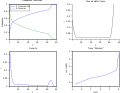 Courbes fiabilite lambda en baignoire.svg 584 × 455; 135 KB
-
 Courbes fiabilite lambda en parabole.svg 584 × 455; 142 KB
-
 Courbes fiabilite weibull beta 0 8.svg 584 × 455; 93 KB
-
 Courbes fiabilite weibull beta 2 5.svg 584 × 455; 96 KB
-
 Curva de la bañera.png 323 × 305; 9 KB
-
 Definition TTF TBF TTR.svg 312 × 95; 16 KB
-
 Duree de fonctionnement effectif.svg 514 × 171; 17 KB
-
 Essais contrainte admissible pour duree de vie imposee.svg 111 × 211; 19 KB
-
 Essais dommages cumules.svg 247 × 187; 31 KB
-
 Essais durée de vie essais contrainte imposee.svg 123 × 215; 22 KB
-
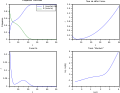
 Exemple fiabilite F R lambda.svg 519 × 775; 75 KB
-
 Exemple fiabilite locotracteurs F R intervalle confiance.svg 499 × 454; 85 KB
-
 Fiabilite essai censure mort subite elements retires.svg 303 × 326; 51 KB
-
 Fiabilite essais tronques methodes escalier et iterative.svg 304 × 470; 57 KB
-
 Fiabilite exponentielle frequences cumulees lambda.svg 273 × 455; 54 KB
-
 Fiabilite lambda en baignoire frequences cumulees lambda.svg 276 × 455; 92 KB
-
 Fiabilite lambda en parabole frequences cumules lambda.svg 273 × 452; 106 KB
-
 Fiabilite weibull beta 0 8 frequences cumulées lambda.svg 276 × 455; 66 KB
-
 Fiabilite weibull beta 2 5 frequences cumulées lambda.svg 273 × 455; 70 KB
-
 Km plot.jpg 384 × 331; 15 KB
-
 MissionEffectiveness.png 582 × 292; 11 KB
-
 Normal plot of years to Armageddon.png 960 × 960; 65 KB
-
 RACI Chart 02.jpg 960 × 720; 82 KB
-
 Regression lois statistiques fiabilite locotracteur.svg 584 × 456; 242 KB
-
 Reliability of the 7 Down depression form based on Item Response Theory.png 1,783 × 976; 69 KB
-
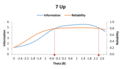 Reliability of the 7 Up mania form based on Item Response Theory.png 1,822 × 1,043; 66 KB
-
 Reliability of the GBI Depression 10 item form A, based on Item Response Theory.png 1,861 × 1,018; 74 KB
-
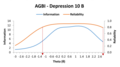 Reliability of the GBI Depression 10 item form B, based on Item Response Theory.png 1,853 × 1,034; 74 KB
-

-
 Risk Cost Analysis.jpg 553 × 295; 58 KB
-
 Series-Parallel-Systems-Examples.jpg 374 × 258; 69 KB
-
 Space Shuttle upgraded GPC.jpg 631 × 441; 153 KB


