Category:Spectrogram
Jump to navigation
Jump to search
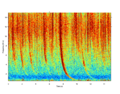
visual representation of the spectrum of frequencies in a sound or other signal as they vary with time or some other variable. Typical representation: time on X-axis, frequency (Hz) on Y-axis, amplitude/volume as range of colors, red being loudest | |||||
| Upload media | |||||
| Subclass of | |||||
|---|---|---|---|---|---|
| Different from | |||||
| |||||
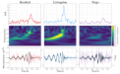
A spectrogram is the result of calculating the frequency spectrum of windowed frames of a compound signal. It is a three-dimensional plot of the energy of the frequency content of a signal as it changes over time.
Subcategories
This category has the following 2 subcategories, out of 2 total.
3
- 3D Spectrogram (4 F)
A
Media in category "Spectrogram"
The following 106 files are in this category, out of 106 total.
-
 1965-11-09 blackout.png 944 × 591; 295 KB
-
 23eruption.png 1,203 × 600; 198 KB
-
 68448 pinkyfinger Piano G-2 spectrogram.png 1,072 × 846; 400 KB
-
-
 A spektrogramm.png 424 × 416; 172 KB
-
 Abschaltung Sender Muehlacker.JPG 818 × 584; 166 KB
-
 Akblue52a 256 064c.jpg 300 × 137; 15 KB
-
 AM Espectro.png 478 × 385; 332 KB
-
 Analiza cech suprasegmentalnych języka polskiego Fig.7.1 (p.63).jpg 1,466 × 946; 125 KB
-
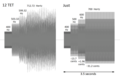 Barbersharp 12TET and 4-5-6-7 audacity.png 1,360 × 868; 83 KB
-
 Chirp function.TIF 730 × 407; 30 KB
-
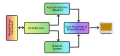 ColourFlowSonographicImagingSystemBlockDiagram-de.svg 728 × 339; 40 KB
-
 Corrupted and reconstructed spectrogram.png 1,399 × 1,919; 2.19 MB
-
 CQT-piano-chord.png 784 × 556; 78 KB
-
 Dial up modem noises explained final.png 2,500 × 1,301; 844 KB
-
 Dial-up sound spectrogram w labels.png 1,799 × 584; 1.37 MB
-
 Dial-up sound spectrogram.png 1,799 × 584; 1.4 MB
-
 Dolphin1.jpg 431 × 324; 140 KB
-
 E spektrogramm.png 424 × 416; 157 KB
-
 Especrtograma harmònic.png 1,824 × 1,023; 483 KB
-
 Espectre.jpg 285 × 177; 11 KB
-
 Espectrograma resonant.png 1,803 × 1,017; 517 KB
-
 Espectrogramas.png 694 × 347; 263 KB
-
 Expchirp.jpg 588 × 393; 197 KB
-
 FFT (WinSize=500).jpg 1,500 × 1,000; 165 KB
-
 Fft banda estreta.jpg 2,157 × 1,413; 308 KB
-
 GC-spectrogram van EtOH uit referentiestaal.png 804 × 567; 22 KB
-
 GC-spectrogram van EtOH uit suikerbiet.png 874 × 616; 20 KB
-
 Green-red in Lab.jpg 1,731 × 1,158; 148 KB
-
 GW151226.png 500 × 389; 185 KB
-
 GW170104 qscan.svg 306 × 473; 992 KB
-
 GW170608 spectrograms.png 4,050 × 4,068; 866 KB
-
 GW170814 signal.png 4,159 × 2,570; 2.54 MB
-
 GW170817 Gravitational Wave Chirp Spectrogram.jpg 4,648 × 1,810; 1.49 MB
-
 GW170817 signal.png 529 × 751; 503 KB
-
 GW170817 spectrograms.svg 738 × 1,058; 656 KB
-
 HumBack2.jpg 588 × 393; 219 KB
-
 LinearChirp.jpg 588 × 393; 199 KB
-
 M17 spectrogram.png 388 × 386; 216 KB
-
 Methamphetamine PMR.png 1,165 × 816; 16 KB
-
 Minato spectrogram.png 881 × 662; 147 KB
-
 Open Cubic Player.png 1,026 × 801; 288 KB
-
 Parus major sonagram.jpg 954 × 277; 19 KB
-
 Plasmao2n2 spektrum.png 1,400 × 1,082; 153 KB
-
 Praat-zh-cmn-cosc-斯.png 3,300 × 5,100; 3.93 MB
-
 RBS-spektrogram TiN-skikt på Si.PNG 640 × 553; 1,016 bytes
-
-
 Sonagraph old.jpg 4,320 × 3,240; 3.05 MB
-
 Sonic visualiser melodic range spectrogram example.jpg 854 × 480; 18 KB
-
 Spectrogr1.jpg 501 × 746; 104 KB
-
 Spectrogram and sonogram of Phrynobatrachus bibita.jpg 1,385 × 760; 144 KB
-
 Spectrogram close-mid front rounded vowel (IPA ø).png 3,000 × 1,700; 2.71 MB
-
 Spectrogram close-mid front unrounded vowel (IPA e).png 3,000 × 1,700; 2.71 MB
-
 Spectrogram near-close near-back rounded vowel (IPA ʊ).png 3,000 × 1,700; 2.58 MB
-
 Spectrogram near-close near-front unrounded vowel (IPA ɪ).png 3,000 × 1,700; 2.74 MB
-
 Spectrogram of close back unrounded vowel (IPA ɯ).png 3,000 × 1,700; 2.73 MB
-
 Spectrogram of close central rounded vowel (IPA ʉ).png 3,000 × 1,700; 2.78 MB
-
 Spectrogram of close central unrounded vowel (IPA ɨ).png 3,000 × 1,700; 2.76 MB
-
 Spectrogram of close front rounded vowel (IPA y).png 3,000 × 1,700; 2.78 MB
-
 Spectrogram of close front unrounded vowel (IPA i).png 3,000 × 1,700; 2.47 MB
-
 Spectrogram of close-mid back rounded vowel (IPA o).png 3,000 × 1,700; 2.64 MB
-
 Spectrogram of close-mid back unrounded vowel (IPA ɤ).png 3,000 × 1,700; 2.77 MB
-
 Spectrogram of close-mid central rounded vowel (IPA ɵ).png 3,000 × 1,700; 2.68 MB
-
 Spectrogram of close-mid central unrounded vowel (IPA ɘ).png 3,000 × 1,700; 2.72 MB
-
 Spectrogram of near-close near-front rounded vowel (IPA ʏ).png 3,000 × 1,700; 2.62 MB
-
 Spectrogram of open-mid back rounded vowel (IPA ɔ).png 3,000 × 1,700; 2.72 MB
-
 Spectrogram of open-mid back unrounded vowel (IPA ʌ).png 3,000 × 1,700; 2.73 MB
-
 Spectrogram of open-mid central rounded vowel (IPA ɞ).png 3,000 × 1,700; 2.72 MB
-
 Spectrogram of open-mid front rounded vowel (IPA œ).png 3,000 × 1,700; 2.26 MB
-
 Spectrogram of open-mid front unrounded vowel (IPA ɛ).png 3,000 × 1,700; 2.63 MB
-
 Spectrogram of Papuan Malay sentence de bicara keras.png 1,800 × 1,200; 826 KB
-
 Spectrogram.jpg 587 × 389; 123 KB
-
 Spectrograms and sonorograms of Ethiopian Phrynobatrachus advertisement calls.jpg 1,385 × 2,232; 434 KB
-
 Spektrogram - Jag skulle vilja.jpg 793 × 489; 64 KB
-
 Spektrogram chirp.png 1,060 × 612; 20 KB
-
 Spektrogram liten.jpg 1,127 × 525; 99 KB
-
 Spettrogramma sinusoide 880 Hz.png 1,889 × 649; 778 KB
-
 SpettrogrammaVocaliAeI.jpg 754 × 450; 166 KB
-
 Start of Summertime 28032010.jpg 501 × 394; 55 KB
-
 STFT and WT.jpg 538 × 165; 20 KB
-
 STFT colored spectrogram 1000ms-de.png 561 × 420; 7 KB
-
 STFT colored spectrogram 1000ms.png 560 × 420; 7 KB
-
 STFT colored spectrogram 125ms-de.png 561 × 420; 7 KB
-
 STFT colored spectrogram 125ms.png 560 × 420; 7 KB
-
 STFT colored spectrogram 25ms-de.png 561 × 419; 9 KB
-
 STFT colored spectrogram 25ms.png 560 × 420; 9 KB
-
 STFT colored spectrogram 375ms-de.png 561 × 420; 6 KB
-
 STFT colored spectrogram 375ms.png 560 × 420; 7 KB
-
 STFT Spectrogram 1000ms.png 560 × 420; 5 KB
-
 STFT Spectrogram 125ms.png 560 × 420; 6 KB
-
 STFT Spectrogram 25ms.png 560 × 420; 7 KB
-
 STFT Spectrogram 375ms.png 560 × 420; 5 KB
-
 STFT WVL compare.jpg 729 × 275; 29 KB
-
 SZ 2011.png 501 × 394; 310 KB
-
 Unknown Sound Spectrogram.png 1,958 × 880; 2.4 MB
-
 Upsweep Espectrograma.jpg 545 × 450; 50 KB
-
 VariableFrequency.jpg 533 × 367; 40 KB
-
 VLF 18.1 kHz spectrogram.svg 721 × 293; 383 KB
-
 VLF Spektrogramme03072016 1.png 501 × 63,099; 48.72 MB
-
 VLF Spektrogramme03072016 2.png 501 × 63,583; 49.89 MB
-
 VLF Spektrogramme03072016 3.png 501 × 63,511; 49.56 MB
-
 VLF whistler.png 1,303 × 1,020; 355 KB
-
 VOWEL I.JPG 800 × 464; 178 KB
-
 Vowel spectrogram.png 1,201 × 901; 104 KB
-
 Whatever you want (by Status Quo, 1979) - Intro spectrogram.png 3,419 × 1,874; 5.13 MB
-
 ZOHBands.png 400 × 768; 62 KB


.jpg)


.jpg)


.png)
.png)
.png)
.png)
.png)
.png)
.png)
.png)
.png)
.png)
.png)
.png)
.png)
.png)
.png)
.png)
.png)
.png)
.png)


_-_Intro_spectrogram.png)
