Category:Unspec SVG created with Gnuplot
Jump to navigation
Jump to search
Subcategories
This category has only the following subcategory.
- Unspec SVG created with Gnuplot code (empty)
Media in category "Unspec SVG created with Gnuplot"
The following 200 files are in this category, out of 1,810 total.
(previous page) (next page)-
 Cult of personality of Putin.svg 512 × 358; 14 KB
-
 Cube root.svg 460 × 244; 1 KB
-
 CriticalFrequencyAliasing.svg 600 × 480; 22 KB
-
 Croissance du PIB de la France et du G7 depuis 1980.svg 600 × 400; 21 KB
-
 Coversine.svg 600 × 480; 13 KB
-
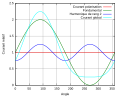 Courant amplificateur bi-harmonique avec harmonique rang 2.svg 600 × 480; 17 KB
-
 Einwohnerentwicklung von Radevormwald - ab 1871.svg 800 × 400; 52 KB
-
 Einwohnerentwicklung von Radevormwald.svg 800 × 400; 54 KB
-
 Cosec proportional.svg 658 × 620; 22 KB
-
 Cosine fixed point.svg 600 × 480; 14 KB
-
 ConstantAcceleration.svg 639 × 622; 92 KB
-
 Composite elastic modulus.svg 600 × 480; 12 KB
-
 Compound interest.svg 600 × 480; 14 KB
-
 Leidersbach Einwohner.svg 800 × 400; 13 KB
-
 Cologne population 1945-1989.svg 800 × 400; 28 KB
-
 PKW nach Treibstoffart in Deutschland.svg 800 × 600; 20 KB
-
 ClueBot NG new user revert probability.svg 600 × 480; 11 KB
-
 Einwohnerentwicklung von Merseburg.svg 800 × 400; 60 KB
-
 Échanges commerciaux du Canada depuis janvier 1988.svg 600 × 400; 163 KB
-
 Einwohnerentwicklung von Leipzig - -1944.svg 800 × 400; 27 KB
-
 Chinapop.svg 800 × 600; 16 KB
-
 ChinaDemography since1950.svg 512 × 320; 20 KB
-
 ChinaDemography.svg 512 × 320; 17 KB
-
 Chi distribution CDF.svg 512 × 384; 17 KB
-
 Chi distribution PDF.svg 512 × 384; 17 KB
-
 Elliptic curve on Z89.svg 987 × 610; 43 KB
-
 Einwohnerentwicklung von Apolda.svg 800 × 400; 57 KB
-
 AustralianReligiousAffiliation 2.svg 600 × 400; 166 KB
-
 PDE solution qtl1.svg 600 × 480; 529 KB
-
 PDE solution qtl2.svg 600 × 480; 529 KB
-
 PDE solution qtl3.svg 600 × 480; 530 KB
-
 Largenumbers.svg 600 × 480; 25 KB
-
 Einwohnerentwicklung von Aalen (log10).svg 800 × 400; 43 KB
-
 US Solar Electricity Production.svg 1,200 × 800; 15 KB
-
 Gnuplot heart.svg 600 × 480; 9 KB
-
 Butterworth response.svg 512 × 384; 41 KB
-
 FRA stats.svg 800 × 400; 26 KB
-
 Fukushima Dosis qtl1.svg 750 × 480; 37 KB
-
 GermanyWind.svg 600 × 400; 18 KB
-
 Windenergygermany.svg 800 × 400; 21 KB
-
 Butterworth orders.svg 800 × 600; 68 KB
-
 Hochpass 1. u. 2. Ordnung.svg 600 × 480; 212 KB
-
 KATRIN Spectrum.svg 1,000 × 800; 72 KB
-
 Reserve currencies total.svg 900 × 600; 29 KB
-
 Union Membership and Support.svg 800 × 500; 19 KB
-
 Radiocarbon dating calibration.svg 600 × 480; 19 KB
-
 Box orbit begin.svg 512 × 410; 17 KB
-
 Box orbit full.svg 512 × 410; 17 KB
-
 Box orbit resonance.svg 512 × 410; 6 KB
-
 Boost continuo discontinuo.svg 600 × 480; 40 KB
-
 Bonn population.svg 800 × 400; 27 KB
-
 Bochum population.svg 800 × 400; 44 KB
-
 Bode-Diagramm-d.svg 600 × 480; 20 KB
-
 Bode-diagramm-p.svg 600 × 480; 16 KB
-
 Bode-diagramm-pt1.svg 600 × 480; 19 KB
-
 Ivw heim und welt.svg 1,500 × 750; 23 KB
-
 Black and white ISO speed.svg 640 × 480; 10 KB
-
 Black Monday FTSE.svg 600 × 480; 14 KB
-
 Bielefeld population.svg 800 × 400; 24 KB
-
 Beta distribution cdf.svg 566 × 425; 80 KB
-
 Beta prime cdf.svg 512 × 384; 17 KB
-
 Beta prime pdf.svg 512 × 384; 18 KB
-
 Betrag qtl1.svg 600 × 480; 11 KB
-
 Fahrgastzahlen VBB.svg 800 × 600; 18 KB
-
 BesselI plot.svg 600 × 480; 16 KB
-
 BesselK plot.svg 600 × 480; 40 KB
-
 Bestapproximation qtl1.svg 545 × 460; 20 KB
-
 Berlin population.svg 800 × 400; 39 KB
-
 Berlin population2.svg 800 × 400; 33 KB
-
 Berlin population3.svg 800 × 400; 22 KB
-
 Berlin population4.svg 800 × 400; 25 KB
-
 Berlin population5.svg 800 × 400; 33 KB
-
 Berlin Lichtenberg (Bezirk) population.svg 800 × 400; 26 KB
-
 Bdrates of Japan since 1950.svg 512 × 320; 24 KB
-
 Backward Iteration.svg 1,000 × 1,000; 21 KB
-
 Bad Wiessee Einwohnerentwicklung 1.svg 700 × 400; 37 KB
-
 Bad Wiessee Schuldenentwicklung 1.svg 512 × 311; 104 KB
-
 Einwohnerentwicklung von Dinslaken - ab 1871.svg 800 × 400; 46 KB
-
 Einwohnerentwicklung von Dinslaken.svg 800 × 400; 43 KB
-
 Einwohnerentwicklung von Hof (Saale).svg 800 × 400; 68 KB
-
 Einwohnerentwicklung von Zwickau.svg 800 × 400; 72 KB
-
 Zwickau population.svg 800 × 400; 21 KB
-
 Einwohnerentwicklung von Nürnberg - ab 1871.svg 800 × 400; 69 KB
-
 Einwohnerentwicklung von Nürnberg.svg 800 × 400; 76 KB
-
 Mandelbrot Components.svg 1,000 × 1,000; 853 KB
-
 Einwohnerentwicklung von Hannover mit Prognosen.svg 800 × 400; 47 KB
-
 Arcsin2.svg 600 × 480; 15 KB
-
 Gnuplot x**2.svg 512 × 410; 12 KB
-
 Sčítání obyvatelstva 2011, bez náboženského vyznání, věková struktura.svg 1,200 × 1,200; 33 KB
-
 Population of Jordan since 1952.svg 512 × 320; 30 KB
-
 Haitz law.svg 600 × 480; 9 KB
-
 Speedup.svg 600 × 480; 13 KB
-
 Einwohnerentwicklung von Kaiserslautern.svg 800 × 400; 79 KB
-
 Altersstruktur von Köln - Teilbereich.svg 800 × 400; 57 KB
-
 All.svg 512 × 410; 26 KB
-
 Airy pattern scaled.svg 640 × 480; 15 KB
-
 Einwohnerentwicklung von Flensburg - ab 1871.svg 800 × 400; 66 KB
-
 Einwohnerentwicklung von Flensburg - Prognosen.svg 800 × 400; 50 KB
-
 Einwohnerentwicklung von Kiel bis 1900.svg 800 × 400; 31 KB
-
 Einwohnerentwicklung von Kiel von 1900 bis 1944.svg 800 × 400; 30 KB
-
 Einwohnerentwicklung von Lübeck seit 1800.svg 800 × 400; 20 KB
-
 Einwohnerentwicklung von Osterode am Harz.svg 800 × 400; 72 KB
-
 Einwohnerentwicklung von Mülhausen.svg 800 × 400; 36 KB
-
 Hamburg population.svg 800 × 400; 43 KB
-
 Einwohnerentwicklung von Haßloch.svg 800 × 400; 58 KB
-
 Einwohnerentwicklung von Puderbach.svg 800 × 400; 57 KB
-
 Einwohnerentwicklung von Teterow.svg 800 × 400; 60 KB
-
 Einwohnerentwicklung von Jever.svg 800 × 400; 56 KB
-
 Einwohnerentwicklung Jülich ab 1800.svg 800 × 400; 27 KB
-
 Einwohnerentwicklung von Bayreuth.svg 800 × 400; 67 KB
-
 Einwohnerentwicklung von Binningen.svg 800 × 400; 24 KB
-
 Einwohnerentwicklung von Bodenwerder.svg 800 × 400; 57 KB
-
 Einwohnerentwicklung von Friedberg (Hessen).svg 800 × 400; 35 KB
-
 Einwohnerentwicklung von Graz.svg 800 × 400; 57 KB
-
 Einwohnerentwicklung von Gütersloh ab 1800.svg 800 × 400; 27 KB
-
 Einwohnerentwicklung von Konstanz.svg 800 × 400; 51 KB
-
 Einwohnerentwicklung von Lübeck (hochauflösend).svg 1,600 × 800; 72 KB
-
 Einwohnerentwicklung von Lübeck von 1227 bis 1870.svg 800 × 400; 31 KB
-
 Einwohnerentwicklung von Memmingen - vergl. Gebietstände.svg 800 × 400; 21 KB
-
 Einwohnerentwicklung von Nordhausen.svg 800 × 400; 85 KB
-
 Einwohnerentwicklung von Singen (Hohentwiel).svg 800 × 400; 47 KB
-
 Einwohnerentwicklung von Villingen im Schwarzwald.svg 800 × 400; 60 KB
-
 Einwohnerentwicklung von Weil am Rhein.svg 800 × 400; 60 KB
-
 Muenster population (1500 - ).svg 800 × 400; 30 KB
-
 Einwohnerentwicklung des Landkreis Ostprignitz-Ruppin.svg 800 × 400; 21 KB
-
 Einwohnerentwicklung von Aue (Sachsen).svg 800 × 400; 67 KB
-
 Einwohnerentwicklung von Bad Brambach.svg 800 × 400; 51 KB
-
 Einwohnerentwicklung von Bad Salzdetfurth.svg 800 × 400; 59 KB
-
 Einwohnerentwicklung von Bad Schwartau.svg 800 × 400; 52 KB
-
 Einwohnerentwicklung von Borna.svg 800 × 400; 52 KB
-
 Einwohnerentwicklung von Braunfels.svg 800 × 400; 21 KB
-
 Einwohnerentwicklung von Bruchmachtersen.svg 800 × 400; 53 KB
-
 Einwohnerentwicklung von Buchholz in der Nordheide.svg 800 × 400; 59 KB
-
 Einwohnerentwicklung von Diefflen.svg 800 × 400; 74 KB
-
 Einwohnerentwicklung von Dietzenbach.svg 800 × 400; 60 KB
-
 Einwohnerentwicklung von Dornum.svg 800 × 400; 56 KB
-
 Einwohnerentwicklung von Düsseldorf (1200x400px).svg 1,200 × 400; 56 KB
-
 Einwohnerentwicklung von Düsseldorf - Prognosen.svg 800 × 400; 57 KB
-
 Einwohnerentwicklung von Düsseldorf ab 1871.svg 800 × 400; 66 KB
-
 Einwohnerentwicklung von Ebersbach-Sa..svg 800 × 400; 57 KB
-
 Einwohnerentwicklung von Eisenhüttenstadt.svg 800 × 400; 59 KB
-
 Einwohnerentwicklung von Eschwege.svg 800 × 400; 40 KB
-
 Einwohnerentwicklung von Flensburg 1436-1944.svg 800 × 400; 25 KB
-
 Einwohnerentwicklung von Frankfurt (Oder) - Ab 1990.svg 800 × 400; 20 KB
-
 Einwohnerentwicklung von Frankfurt (Oder) - Prognosen.svg 800 × 400; 57 KB
-
 Einwohnerentwicklung von Fürstenberg (Havel).svg 800 × 400; 49 KB
-
 Einwohnerentwicklung von Gerlingen.svg 800 × 400; 46 KB
-
 Einwohnerentwicklung von Gießen.svg 800 × 400; 87 KB
-
 Einwohnerentwicklung von Goslar.svg 800 × 400; 71 KB
-
 Einwohnerentwicklung von Greiz.svg 800 × 400; 30 KB
-
 Einwohnerentwicklung von Görlitz.svg 800 × 400; 37 KB
-
 Einwohnerentwicklung von Hagen 1722-1870.svg 800 × 400; 15 KB
-
 Einwohnerentwicklung von Hagen 1871-1944.svg 800 × 400; 30 KB
-
 Einwohnerentwicklung von Hagen 1990-.svg 800 × 400; 19 KB
-
 Einwohnerentwicklung von Hannover - Prognose 2006–2025.svg 800 × 400; 24 KB
-
 Einwohnerentwicklung von Heide (Holstein).svg 800 × 400; 31 KB
-
 Einwohnerentwicklung von Hemer.svg 800 × 400; 33 KB
-
 Einwohnerentwicklung von Hesselbach (Bad Laasphe).svg 800 × 400; 27 KB
-
 Einwohnerentwicklung von Hildesheim - ab 1871.svg 800 × 400; 54 KB
-
 Einwohnerentwicklung von Hildesheim - ab 1900.svg 800 × 400; 29 KB
-
 Einwohnerentwicklung von Hisel.svg 800 × 400; 57 KB
-
 Einwohnerentwicklung von Hoyerswerda ab 1871.svg 800 × 400; 44 KB
-
 Einwohnerentwicklung von Hoyerswerda ab 1990.svg 800 × 400; 29 KB
-
 Einwohnerentwicklung von Hoyerswerda.svg 800 × 400; 82 KB
-
 Einwohnerentwicklung von Höchberg.svg 800 × 400; 76 KB
-
 Einwohnerentwicklung von Hückeswagen.svg 800 × 400; 36 KB
-
 Einwohnerentwicklung von Ingelheim am Rhein 1815-1939.svg 800 × 400; 21 KB
-
 Einwohnerentwicklung von Jena -1944.svg 800 × 400; 24 KB
-
 Einwohnerentwicklung von Jena 1990-.svg 800 × 400; 19 KB
-
 Einwohnerentwicklung von Karlsruhe -1900.svg 800 × 400; 22 KB
-
 Einwohnerentwicklung von Karlsruhe 1900-1945.svg 800 × 400; 25 KB
-
 Einwohnerentwicklung von Kella.svg 800 × 400; 42 KB
-
 Einwohnerentwicklung von Kilianstädten.svg 800 × 400; 30 KB
-
 Einwohnerentwicklung von Kreis Borken.svg 800 × 400; 41 KB
-
 Einwohnerentwicklung von Kreis Steinburg.svg 800 × 400; 58 KB
-
 Einwohnerentwicklung von Köln - Prognosen.svg 800 × 400; 53 KB
-
 Einwohnerentwicklung von Landkreis Schaumburg.svg 800 × 400; 51 KB
-
 Einwohnerentwicklung von Landkreis Teltow-Fläming.svg 800 × 400; 29 KB
-
 Einwohnerentwicklung von Leipzig - 1945-1989.svg 800 × 400; 31 KB
-
 Einwohnerentwicklung von Leipzig - 1990-.svg 800 × 400; 25 KB
-
 Einwohnerentwicklung von Lindern (Oldenburg).svg 800 × 400; 48 KB
-
 Einwohnerentwicklung von Lörrach.svg 800 × 400; 46 KB
-
 Einwohnerentwicklung von Lünen.svg 800 × 400; 53 KB
-
 Einwohnerentwicklung von Magdeburg ab 1990.svg 800 × 400; 33 KB
-
 Einwohnerentwicklung von Magdeburg von 1400 bis 1870.svg 800 × 400; 28 KB
-
 Einwohnerentwicklung von Magdeburg von 1871 bis 1944.svg 800 × 400; 40 KB
-
 Einwohnerentwicklung von Magdeburg von 1945 bis 1989.svg 800 × 400; 32 KB
-
 Einwohnerentwicklung von Marienwerder (Barnim).svg 800 × 400; 52 KB
-
 Einwohnerentwicklung von Mindelaltheim.svg 800 × 400; 33 KB
-
 Einwohnerentwicklung von Nauen.svg 800 × 400; 65 KB
-
 Einwohnerentwicklung von Nordhausen ab 1800.svg 800 × 400; 27 KB
-
 Einwohnerentwicklung von Nordhorn.svg 800 × 400; 54 KB
-
 Einwohnerentwicklung von Oberntudorf.svg 800 × 400; 53 KB
-
 Einwohnerentwicklung von Offenburg.svg 800 × 400; 84 KB
-
 Einwohnerentwicklung von Parchim.svg 800 × 400; 47 KB
-
 Einwohnerentwicklung von Passau.svg 800 × 400; 58 KB
-
 Einwohnerentwicklung von Pforzheim - Prognosen.svg 800 × 400; 43 KB
-
 Einwohnerentwicklung von Pirna.svg 800 × 400; 63 KB
-
 Einwohnerentwicklung von Radolfzell am Bodensee.svg 800 × 400; 66 KB
-
 Einwohnerentwicklung von Salzgitter 1800-.svg 800 × 400; 25 KB


.svg)


_population.svg)


.svg)


.svg)


.svg)


.svg)


.svg)

.svg)


_-_Ab_1990.svg)
_-_Prognosen.svg)
.svg)


.svg)

.svg)


.svg)


.svg)


.svg)