Category:Vaccination statistics
Jump to navigation
Jump to search
Media in category "Vaccination statistics"
The following 67 files are in this category, out of 67 total.
-

-

-
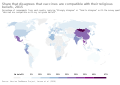
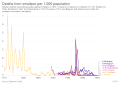 Deaths from smallpox per 1,000 population, OWID.svg 850 × 600; 28 KB
-
 DTP-Vaccination-rate-by-US-State-and-exemption-status-1.png 3,159 × 3,335; 558 KB
-
 Durchimpfungsrate 1-Jaehrige-weltweit.png 3,400 × 2,400; 574 KB
-
 Effects of vaccination.gif 913 × 616; 24 KB
-
 Einstellung zu Impfungen allgemein - Zeitvergleich.png 3,133 × 1,987; 149 KB
-
 Global trend in believing vaccines are not safe.png 3,400 × 2,400; 848 KB
-

-
 Global-smallpox-cases.png 3,400 × 2,400; 495 KB
-
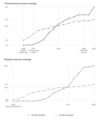
 Global-vaccination-coverage.png 3,400 × 2,400; 536 KB
-
 Gráfico exercício atraso vacinal I IPC II.jpg 798 × 457; 37 KB
-
 Immunization against diphtheria, tetanus, and pertussis, OWID.svg 850 × 600; 142 KB
-

-

-
 Masern in den USA, 1938-2019.png 6,988 × 4,403; 1.2 MB
-
 Masern in den USA, 1938-2019.svg 1,825 × 1,167; 55 KB
-
 Masern in Kanada, 1924-2018.png 6,420 × 4,196; 1.07 MB
-

-
 Maternal tetanus vaccination by neonatal tetanus incidence, OWID.svg 850 × 600; 21 KB
-
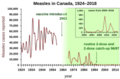 Measles Canada 1924-2018.png 6,420 × 4,196; 1.13 MB
-
 Measles cases graph.svg 750 × 390; 12 KB
-
 Measles US 1938-2019.png 8,064 × 5,081; 1.51 MB
-
 Measles-vaccine-coverage-worldwide-vs-measles-cases-worldwide.jpg 3,400 × 2,400; 185 KB
-
 Measles-vaccine-coverage-worldwide-vs-measles-cases-worldwide.png 3,400 × 2,400; 572 KB
-
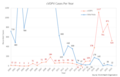 Number of cVDPV cases since 2000.png 718 × 459; 43 KB
-

-
 Number of wild polio and cVDPV cases since 2000 Ar.png 903 × 524; 35 KB
-
 Number of wild polio and cVDPV cases since 2000.png 717 × 521; 48 KB
-
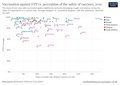 Perception-of-the-safety-of-vaccines-vs-vaccine-coverage.png 3,400 × 2,400; 589 KB
-
 Pneumococcal and rotavirus vaccine coverage (Gavi and non-Gavi countries).png 2,100 × 2,520; 181 KB
-

-
 Polio- Rate of cases vs vaccination coverage, OWID.svg 850 × 600; 104 KB
-

-
 Preventable child deaths from rotavirus vaccination, OWID.svg 850 × 600; 11 KB
-
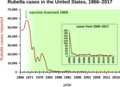 Rubella in the US 1966-2017.png 3,383 × 2,462; 529 KB
-
 Röteln in den USA 1966-2017.png 3,383 × 2,439; 520 KB
-
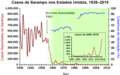 Sarampo EUA 1938-2019.png 8,064 × 5,081; 1.37 MB
-

-

-

-

-

-
-

-

-
 Share that disagrees that vaccines are effective, OWID.svg 850 × 600; 140 KB
-

-

-

-
 Share that disagrees that vaccines are safe in Europe, OWID.svg 850 × 600; 146 KB
-
 Share that disagrees that vaccines are safe, OWID.svg 850 × 600; 140 KB
-

-

-

-
 Share-of-vaccinated-one-year-olds-globally.png 3,400 × 2,400; 461 KB
-
 Tetanus cases vs tetanus vaccination coverage, OWID.svg 850 × 600; 32 KB
-
 Tetanus vaccination coverage vs tetanus cases, OWID.svg 850 × 600; 24 KB
-
 The World as 100 People.png 5,343 × 3,663; 444 KB
-

-
 Tuberculosis in the USA 1861-2014.png 4,791 × 3,468; 364 KB
-
 Vaccination coverage (DPT) vs GDP per capita, OWID.svg 850 × 600; 42 KB
-

-
 Vaccination coverage by income, OWID.svg 850 × 600; 32 KB
-
 Vaccination-coverage-by-income-in.png 3,400 × 2,400; 678 KB
-
 Vaccination-introduction-and-cases-or-deaths-scaled.jpg 1,827 × 2,560; 477 KB
-
 Vaccine coverage rates among preschool-aged children (1967-2012).gif 822 × 431; 23 KB
,_OWID.svg)


_immunization,_OWID.svg)


.png)
.svg)


),_OWID.svg)
),_OWID.svg)

),_1,_OWID.svg)
),_OWID.svg)

),_OWID.svg)

),_OWID.svg)


),_OWID.svg)
),_OWID.svg)
),_OWID.svg)


_vs_GDP_per_capita,_OWID.svg)
_vs._share_of_the_population_living_in_extreme_poverty,_OWID.svg)


.gif)