File:3 phase rectification 2.svg
Jump to navigation
Jump to search

Size of this PNG preview of this SVG file: 397 × 600 pixels. Other resolutions: 159 × 240 pixels | 317 × 480 pixels | 508 × 768 pixels | 677 × 1,024 pixels | 1,355 × 2,048 pixels | 624 × 943 pixels.
Original file (SVG file, nominally 624 × 943 pixels, file size: 120 KB)
Captions
Captions
Add a one-line explanation of what this file represents
Summary
[edit]| Description |
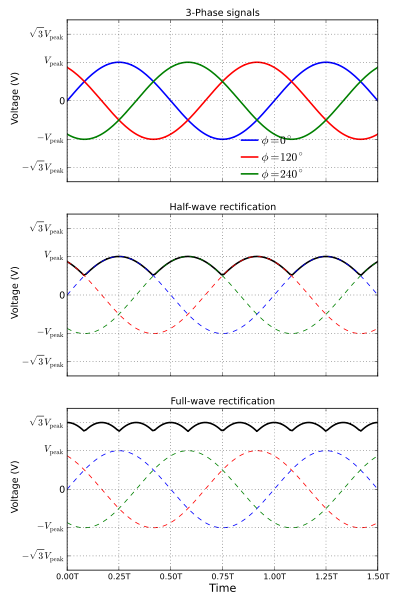
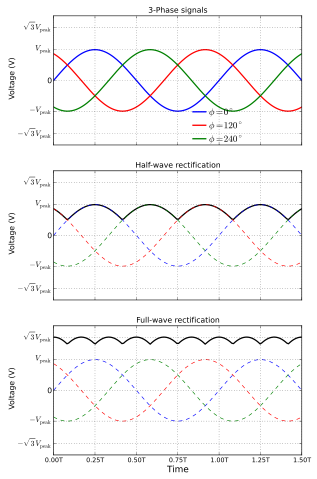
English: Waveforms for a typical 3-phase half-wave and full-wave rectifiers. The top plot shows the individual three phase signals, the middle plot shows the half-wave rectifier output in solid curve and the bottom plot shows the full-wave rectifier output in solid curve. The 'T' in time is the time period of individual signals and is the amplitude of each of the three input signals.
The diagram was created using python, matplotlib and numpy.
Русский: Формы сигналов трёхфазного одно- и двухполупериодного выпрямителей. Сверху - отдельные трехфазные сигналы, средний график - выход однополупериодного выпрямителя сплошной линией, нижний график - выходной сигнал двухполупериодного выпрямителя сплошной линией. T - период, U - напряжения. |
||
| Date | |||
| Source | Own work | ||
| Author | Krishnavedala | ||
| Other versions |
3 phase rectification 2.png
[]
.png:
.jpg:
|
||
| SVG development | This plot was created with Matplotlib. | ||
| Source code | Python code
|


Licensing
[edit]
I, the copyright holder of this work, hereby publish it under the following licenses:
This file is licensed under the Creative Commons Attribution-Share Alike 3.0 Unported license.
- You are free:
- to share – to copy, distribute and transmit the work
- to remix – to adapt the work
- Under the following conditions:
- attribution – You must give appropriate credit, provide a link to the license, and indicate if changes were made. You may do so in any reasonable manner, but not in any way that suggests the licensor endorses you or your use.
- share alike – If you remix, transform, or build upon the material, you must distribute your contributions under the same or compatible license as the original.

|
Permission is granted to copy, distribute and/or modify this document under the terms of the GNU Free Documentation License, Version 1.2 or any later version published by the Free Software Foundation; with no Invariant Sections, no Front-Cover Texts, and no Back-Cover Texts. A copy of the license is included in the section entitled GNU Free Documentation License. |
You may select the license of your choice.
File history
Click on a date/time to view the file as it appeared at that time.
| Date/Time | Thumbnail | Dimensions | User | Comment | |
|---|---|---|---|---|---|
| current | 15:52, 23 September 2011 | | 624 × 943 (120 KB) | Krishnavedala (talk | contribs) | individual plots are now consistent with each other |
| 17:24, 22 September 2011 |  | 624 × 943 (114 KB) | Krishnavedala (talk | contribs) | final correction, hopefully!! | |
| 17:20, 22 September 2011 |  | 640 × 943 (116 KB) | Krishnavedala (talk | contribs) | corrected Time coordinates | |
| 17:04, 22 September 2011 |  | 623 × 943 (115 KB) | Krishnavedala (talk | contribs) | Corrected the waveforms for the full wave rectification. | |
| 22:06, 30 June 2011 |  | 599 × 944 (175 KB) | Spinningspark (talk | contribs) | Fixed correct use of italics. Fixed annotation outside boundary of image. Output waveform on top of input waveforms. | |
| 19:29, 30 June 2011 |  | 599 × 944 (111 KB) | Krishnavedala (talk | contribs) | removed "(sec)" from the x-axis label | |
| 19:27, 30 June 2011 |  | 599 × 946 (111 KB) | Krishnavedala (talk | contribs) | edits from suggestions in here | |
| 19:51, 17 June 2011 |  | 524 × 874 (142 KB) | Krishnavedala (talk | contribs) | thinner dashed lines | |
| 19:48, 17 June 2011 |  | 524 × 874 (142 KB) | Krishnavedala (talk | contribs) | all plots on the same scale to avoid confusion | |
| 17:18, 8 June 2011 |  | 594 × 946 (223 KB) | Krishnavedala (talk | contribs) | correction in the labels |
You cannot overwrite this file.
File usage on Commons
The following 9 pages use this file:
- File:3 phase rectification 2-ru.svg
- File:3 phase rectification 2.png
- File:3 phase rectification 2.svg
- File:DC voltage profile of B6 three-phase full-wave rectifier.jpg
- File:Terminales positivos y negativos del rectificador.png
- File:Waveform fullwave rectifier3.png
- File:Zwezda-Larionow.jpg
- File:Звезда-ларионов.jpg
- Template:Other versions/3 phase rectification
File usage on other wikis
The following other wikis use this file:
- Usage on ca.wikipedia.org
- Usage on el.wikipedia.org
- Usage on en.wikipedia.org
- Usage on eo.wikipedia.org
- Usage on eu.wikipedia.org
- Usage on ja.wikipedia.org
- Usage on th.wikipedia.org
- Usage on zh.wikipedia.org