File:Quantum confinement effects in the band diagram of quantum dots.tif
Jump to navigation
Jump to search
Size of this JPG preview of this TIF file: 680 × 599 pixels. Other resolutions: 272 × 240 pixels | 545 × 480 pixels | 871 × 768 pixels | 1,162 × 1,024 pixels | 1,359 × 1,198 pixels.
Original file (1,359 × 1,198 pixels, file size: 51 KB, MIME type: image/tiff)
Captions
Captions
Add a one-line explanation of what this file represents
Summary[edit]
| Description |
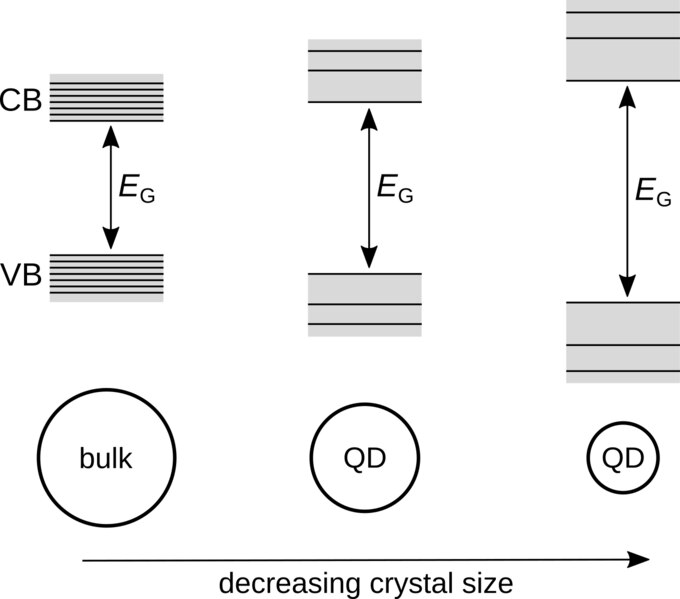
English: Below a critical size, crystals transition from bulk materials to quantum dots (QDs). The QD bandgap increases with decreasing QD size. Note that the energy levels (represented by horizontal lines) get increasingly sparse as the QD size is reduced, causing a distinctive peak at the bandgap energy in their absorbance spectra. |
| Date | |
| Source | Own work |
| Author | Iramiro |
Licensing[edit]
I, the copyright holder of this work, hereby publish it under the following license:
This file is licensed under the Creative Commons Attribution-Share Alike 4.0 International license.
- You are free:
- to share – to copy, distribute and transmit the work
- to remix – to adapt the work
- Under the following conditions:
- attribution – You must give appropriate credit, provide a link to the license, and indicate if changes were made. You may do so in any reasonable manner, but not in any way that suggests the licensor endorses you or your use.
- share alike – If you remix, transform, or build upon the material, you must distribute your contributions under the same or compatible license as the original.
File history
Click on a date/time to view the file as it appeared at that time.
| Date/Time | Thumbnail | Dimensions | User | Comment | |
|---|---|---|---|---|---|
| current | 16:35, 28 July 2023 |  | 1,359 × 1,198 (51 KB) | Iramiro (talk | contribs) | Uploaded own work with UploadWizard |
You cannot overwrite this file.
File usage on Commons
There are no pages that use this file.