File:Shale color chart.png
Jump to navigation
Jump to search

Size of this preview: 776 × 600 pixels. Other resolutions: 311 × 240 pixels | 621 × 480 pixels | 994 × 768 pixels | 1,056 × 816 pixels.
Original file (1,056 × 816 pixels, file size: 35 KB, MIME type: image/png)
Captions
Captions
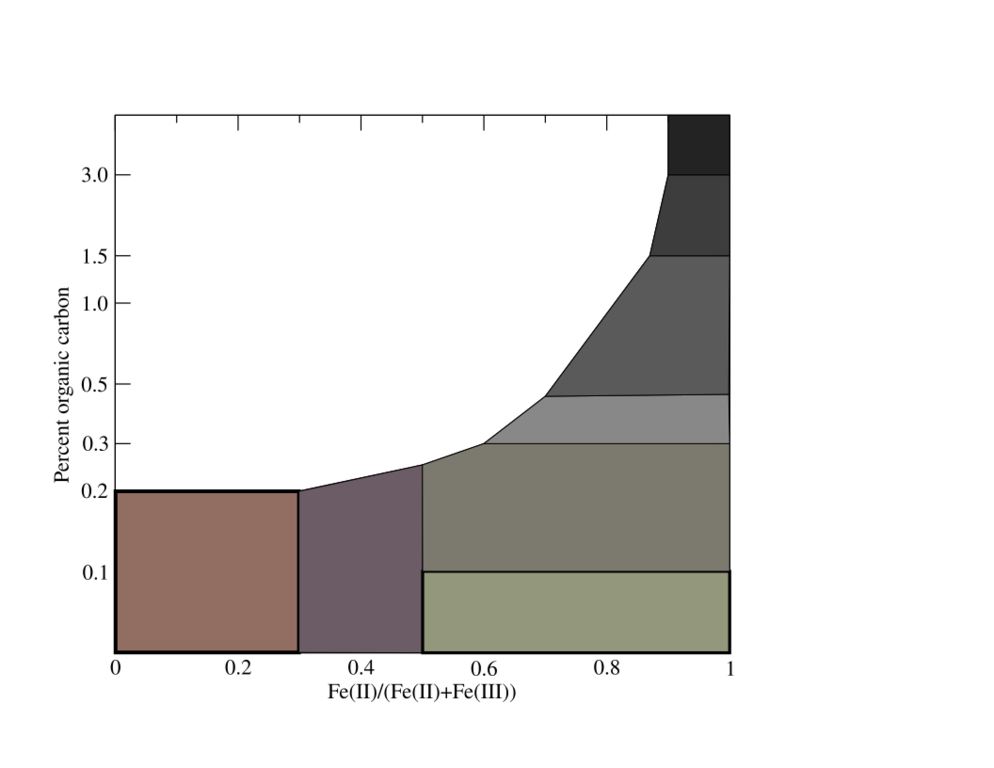
Color chart for shale based on oxidation state and organic carbon content
Summary[edit]
| Description |
English: This diagram shows the approximate color of shale of varying oxidation state and organic carbon content. The oxidation state is expressed as the mole fraction of ferrous iron to total iron. The region at upper left represents compositions unlikely to be found in nature. Based on Potter, Maynard, and Pryor (1980). Sedimentology of shale : study guide and reference source. New York: Springer-Verlag. ISBN 0387904301. |
| Date | |
| Source | Own work |
| Author | Kent G. Budge |
Licensing[edit]
I, the copyright holder of this work, hereby publish it under the following license:
| This file is made available under the Creative Commons CC0 1.0 Universal Public Domain Dedication. | |
| The person who associated a work with this deed has dedicated the work to the public domain by waiving all of their rights to the work worldwide under copyright law, including all related and neighboring rights, to the extent allowed by law. You can copy, modify, distribute and perform the work, even for commercial purposes, all without asking permission.
|
File history
Click on a date/time to view the file as it appeared at that time.
| Date/Time | Thumbnail | Dimensions | User | Comment | |
|---|---|---|---|---|---|
| current | 22:10, 13 April 2021 | | 1,056 × 816 (35 KB) | Kent G. Budge (talk | contribs) | Uploaded own work with UploadWizard |
You cannot overwrite this file.
File usage on Commons
There are no pages that use this file.
File usage on other wikis
The following other wikis use this file:
- Usage on el.wikipedia.org
- Usage on uz.wikipedia.org