File:Temperature reconstruction last two millennia cs.svg

Original file (SVG file, nominally 485 × 325 pixels, file size: 109 KB)
Captions
Captions
Summary[edit]

|
This SVG file contains embedded text that can be translated into your language, using any capable SVG editor, text editor or the SVG Translate tool. For more information see: About translating SVG files. |
| Description |
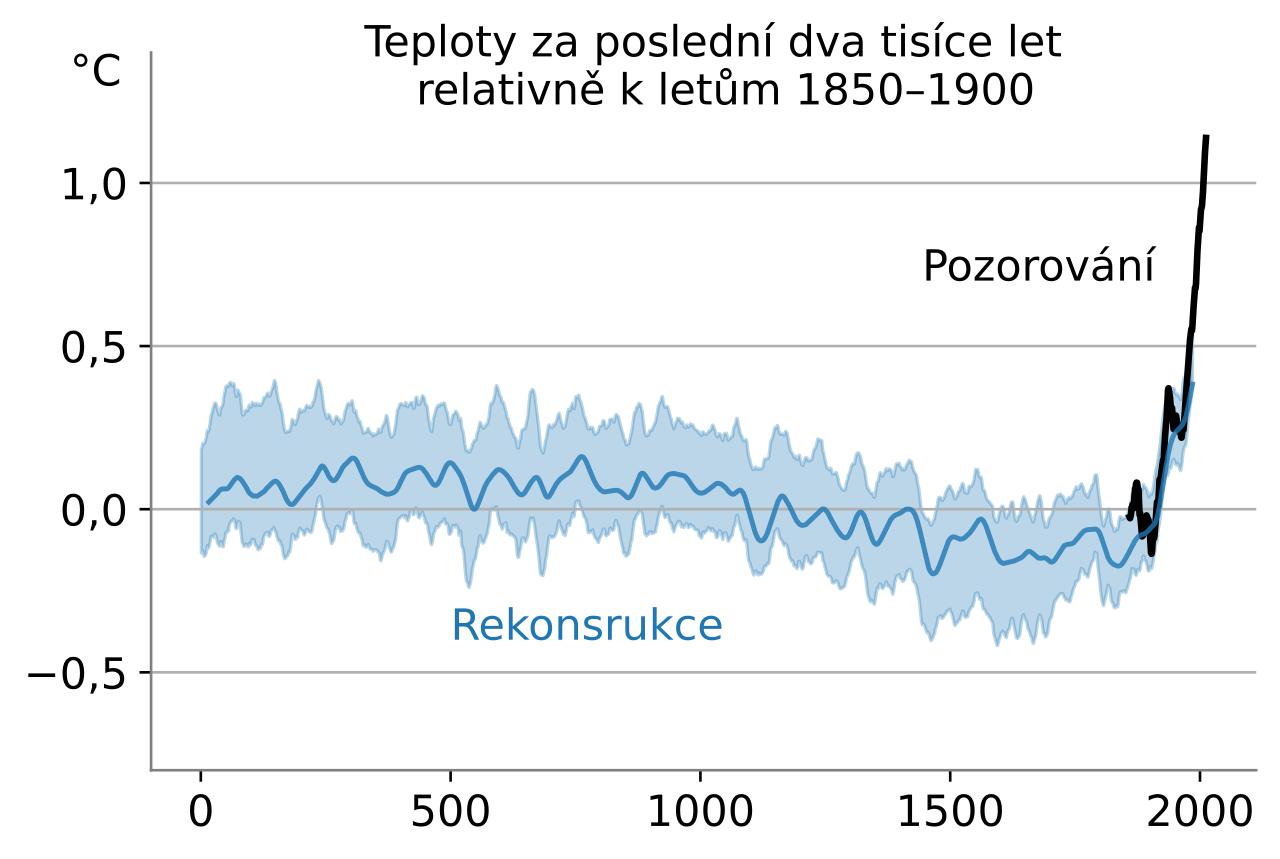
English: Temperatures with respect to the 1850–1900 mean over the last 2 millennia (blue) and observational estimates ranging from 1850 to 2020 (black). The shaded region contains the 68% confidence interval. The temperature anomalies are from the 2019 Nature Geoscience paper by the Pages2k Consortium.[1] using a wide set of proxies that have been vetted by the same consortium.[2] They include tree ring data, data from corals and ice core data.
The confidence interval incorporates two sources of uncertainty. The first one derives from the the method of translating information in the proxies into temperatures. Seven different peer-reviewed methods are employed and all considered equally likely in the figure. The methods range from a simple linear method where proxies sensitivities are fitted to the observational to determine past temperature, to more complicated methods in which information about spatial patterns is taken into account, or information about natural forcing is taken into account. The second type of uncertainty is in the selection of proxies. Some proxies might not be entirely reliable and their inclusion might slightly bias the reconstruction. By randomly selecting a subset of proxies, this uncertainty can be quantified. Code to create the figure is adapted from the Nature Geosciences paper[1] and can be found on https://figshare.com/collections/Global_mean_temperature_reconstructions_over_the_Common_Era/4507043. The figure is a simplification of Fig 1a from this paper. Individual reconstruction methods are not shown. The observational data is HadCRUT5, plotted with a ten-year running mean.[3] references
|
| Date | |
| Source | Own work |
| Author | Femke Nijsse, Czech translation Jirka Dl |
| Other versions |
The above two-millennia chart is included in the following composites:
|


Licensing[edit]
- You are free:
- to share – to copy, distribute and transmit the work
- to remix – to adapt the work
- Under the following conditions:
- attribution – You must give appropriate credit, provide a link to the license, and indicate if changes were made. You may do so in any reasonable manner, but not in any way that suggests the licensor endorses you or your use.
- share alike – If you remix, transform, or build upon the material, you must distribute your contributions under the same or compatible license as the original.
File history
Click on a date/time to view the file as it appeared at that time.
| Date/Time | Thumbnail | Dimensions | User | Comment | |
|---|---|---|---|---|---|
| current | 19:04, 11 October 2023 | | 485 × 325 (109 KB) | Jirka Dl (talk | contribs) | Uploaded own work with UploadWizard |
You cannot overwrite this file.
File usage on Commons
There are no pages that use this file.
File usage on other wikis
The following other wikis use this file:
- Usage on cs.wikipedia.org