File:Three-way differential expression (DE) plot shows three distinct states in the T. gondii wild-type asexual cycle.tif
Jump to navigation
Jump to search

Size of this JPG preview of this TIF file: 779 × 600 pixels. Other resolutions: 312 × 240 pixels | 623 × 480 pixels | 997 × 768 pixels | 1,280 × 986 pixels | 1,470 × 1,132 pixels.
Original file (1,470 × 1,132 pixels, file size: 620 KB, MIME type: image/tiff)
Captions
Captions
Add a one-line explanation of what this file represents
Summary[edit]
| Description |
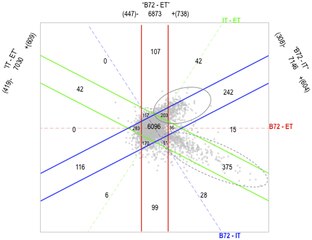
English: This plot slices the 8058 predicted T. gondii genes, (each point represents a gene) into specific gene sets that reflect all possible comparisons of intracellular tachyzoites (IT), extracellular tachyzoites (ET) and bradyzoites after 72 hr induction (B72); (IT – ET, B72 – ET, and B72 – IT). Each comparison is associated with a dashed axis, which captures the magnitude of differential expression associated with the comparison, and two solid lines, which bound the set of genes differentially expressed less than 2-fold by the comparison. Of the 8,058 probe sets, 6,096 (central hexagon) are not changed more than 2-fold between any of the 3 states. The extracellular tachyzoite-specific genes lie at the intersection between genes that are up-regulated in extracellular tachyzoites compared to intracellular tachyzoites (IT-ET ≤−1; n = 419, below the green solid line) and genes that are upregulated in extracellular tachyzoites compared to bradyzoites (B72-ET ≤−1; n = 447, to the left of the red solid line), which total 122 genes. The intracellular tachyzoite-specific genes lie at the intersection between genes that are up-regulated in intracellular tachyzoites compared to extracellular tachyzoites (IT-ET ≥1; n = 609, above the green solid line) and genes that are up-regulated in intracellular tachyzoites compared to bradyzoites (B72-IT ≤−1; n = 308, above the blue solid line), which total 149 genes. And, the bradyzoite-specific genes lie at the intersection between genes that are up-regulated in bradyzoites compared to extracellular tachyzoites (B72-ET≥1; n = 738, to the right of the red solid line) and genes that are up-regulated in bradyzoites compared to intracellular tachyzoites (B72-IT≥1; n = 604, below the blue solid line), which total 418 genes. |
| Date | |
| Source | Template:P Lescault B Thompson, V Patil, D Lirussi, A Burton, J Margarit, J Bond M Matrajt (PLoS One. 2010. 5(12)) |
| Author | Plescault |
Licensing[edit]
I, the copyright holder of this work, hereby publish it under the following license:
This file is licensed under the Creative Commons Attribution 4.0 International license.
- You are free:
- to share – to copy, distribute and transmit the work
- to remix – to adapt the work
- Under the following conditions:
- attribution – You must give appropriate credit, provide a link to the license, and indicate if changes were made. You may do so in any reasonable manner, but not in any way that suggests the licensor endorses you or your use.
| This image was uploaded as part of Wiki Science Competition 2017. |

|
This media file is uncategorized.
Please help improve this media file by adding it to one or more categories, so it may be associated with related media files (how?), and so that it can be more easily found.
Please notify the uploader with {{subst:Please link images|File:Three-way differential expression (DE) plot shows three distinct states in the T. gondii wild-type asexual cycle.tif}} ~~~~ |
File history
Click on a date/time to view the file as it appeared at that time.
| Date/Time | Thumbnail | Dimensions | User | Comment | |
|---|---|---|---|---|---|
| current | 02:04, 6 November 2017 |  | 1,470 × 1,132 (620 KB) | Plescault (talk | contribs) | User created page with UploadWizard |
You cannot overwrite this file.
File usage on Commons
There are no pages that use this file.