File:WHO Covid 2020 Jan-Aug daily C Algeria.pdf
Jump to navigation
Jump to search

Size of this JPG preview of this PDF file: 800 × 473 pixels. Other resolutions: 320 × 189 pixels | 640 × 378 pixels | 1,024 × 605 pixels | 1,280 × 756 pixels | 3,300 × 1,950 pixels.
Original file (3,300 × 1,950 pixels, file size: 24 KB, MIME type: application/pdf)
Captions
Captions
Add a one-line explanation of what this file represents
Summary[edit]
| Description |
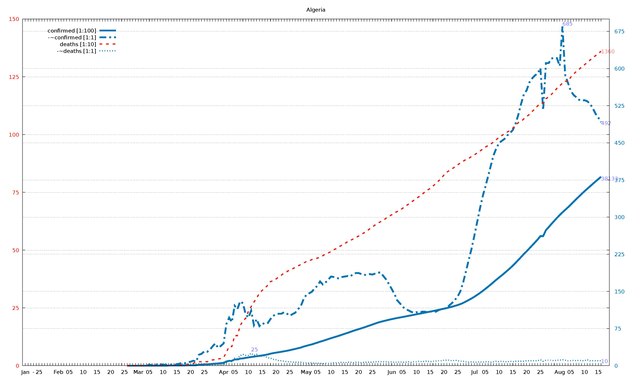
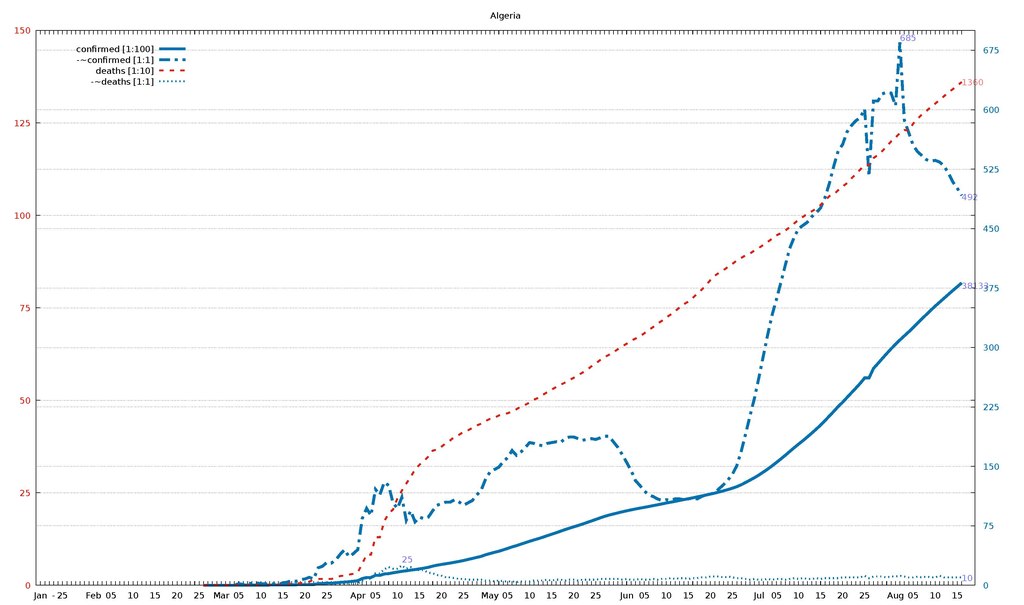
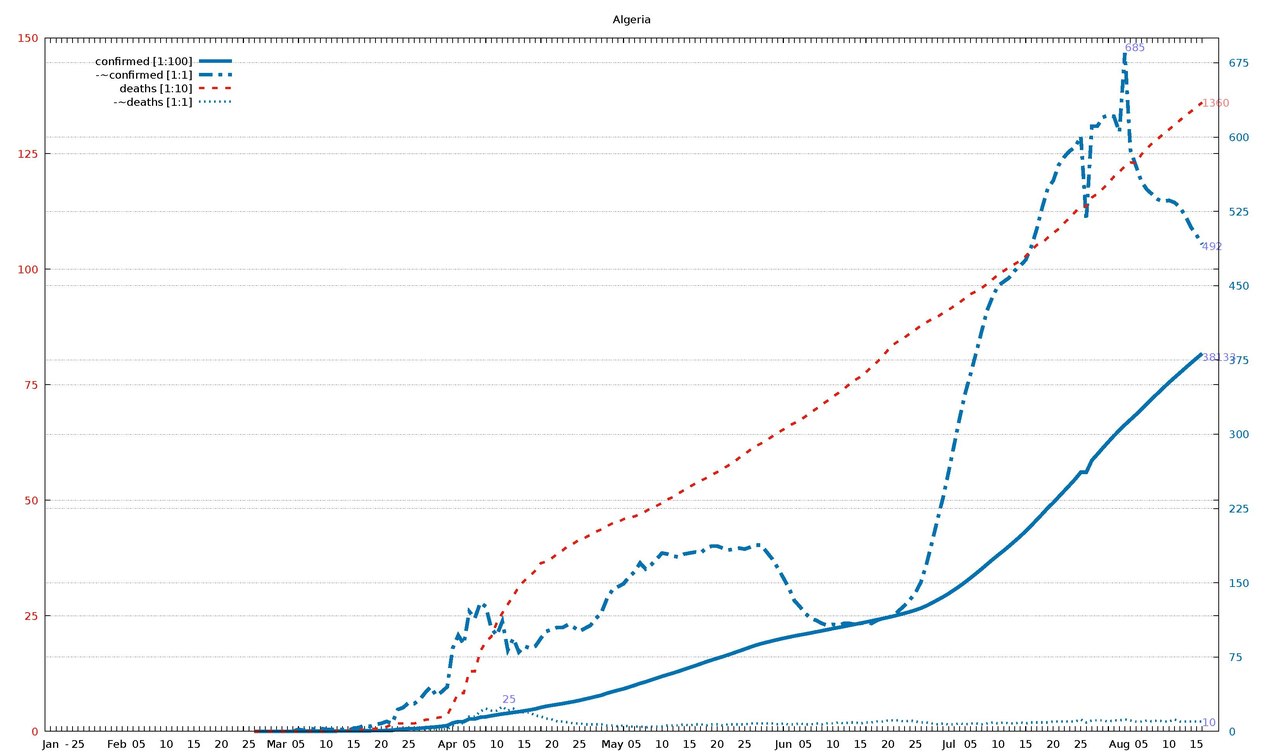
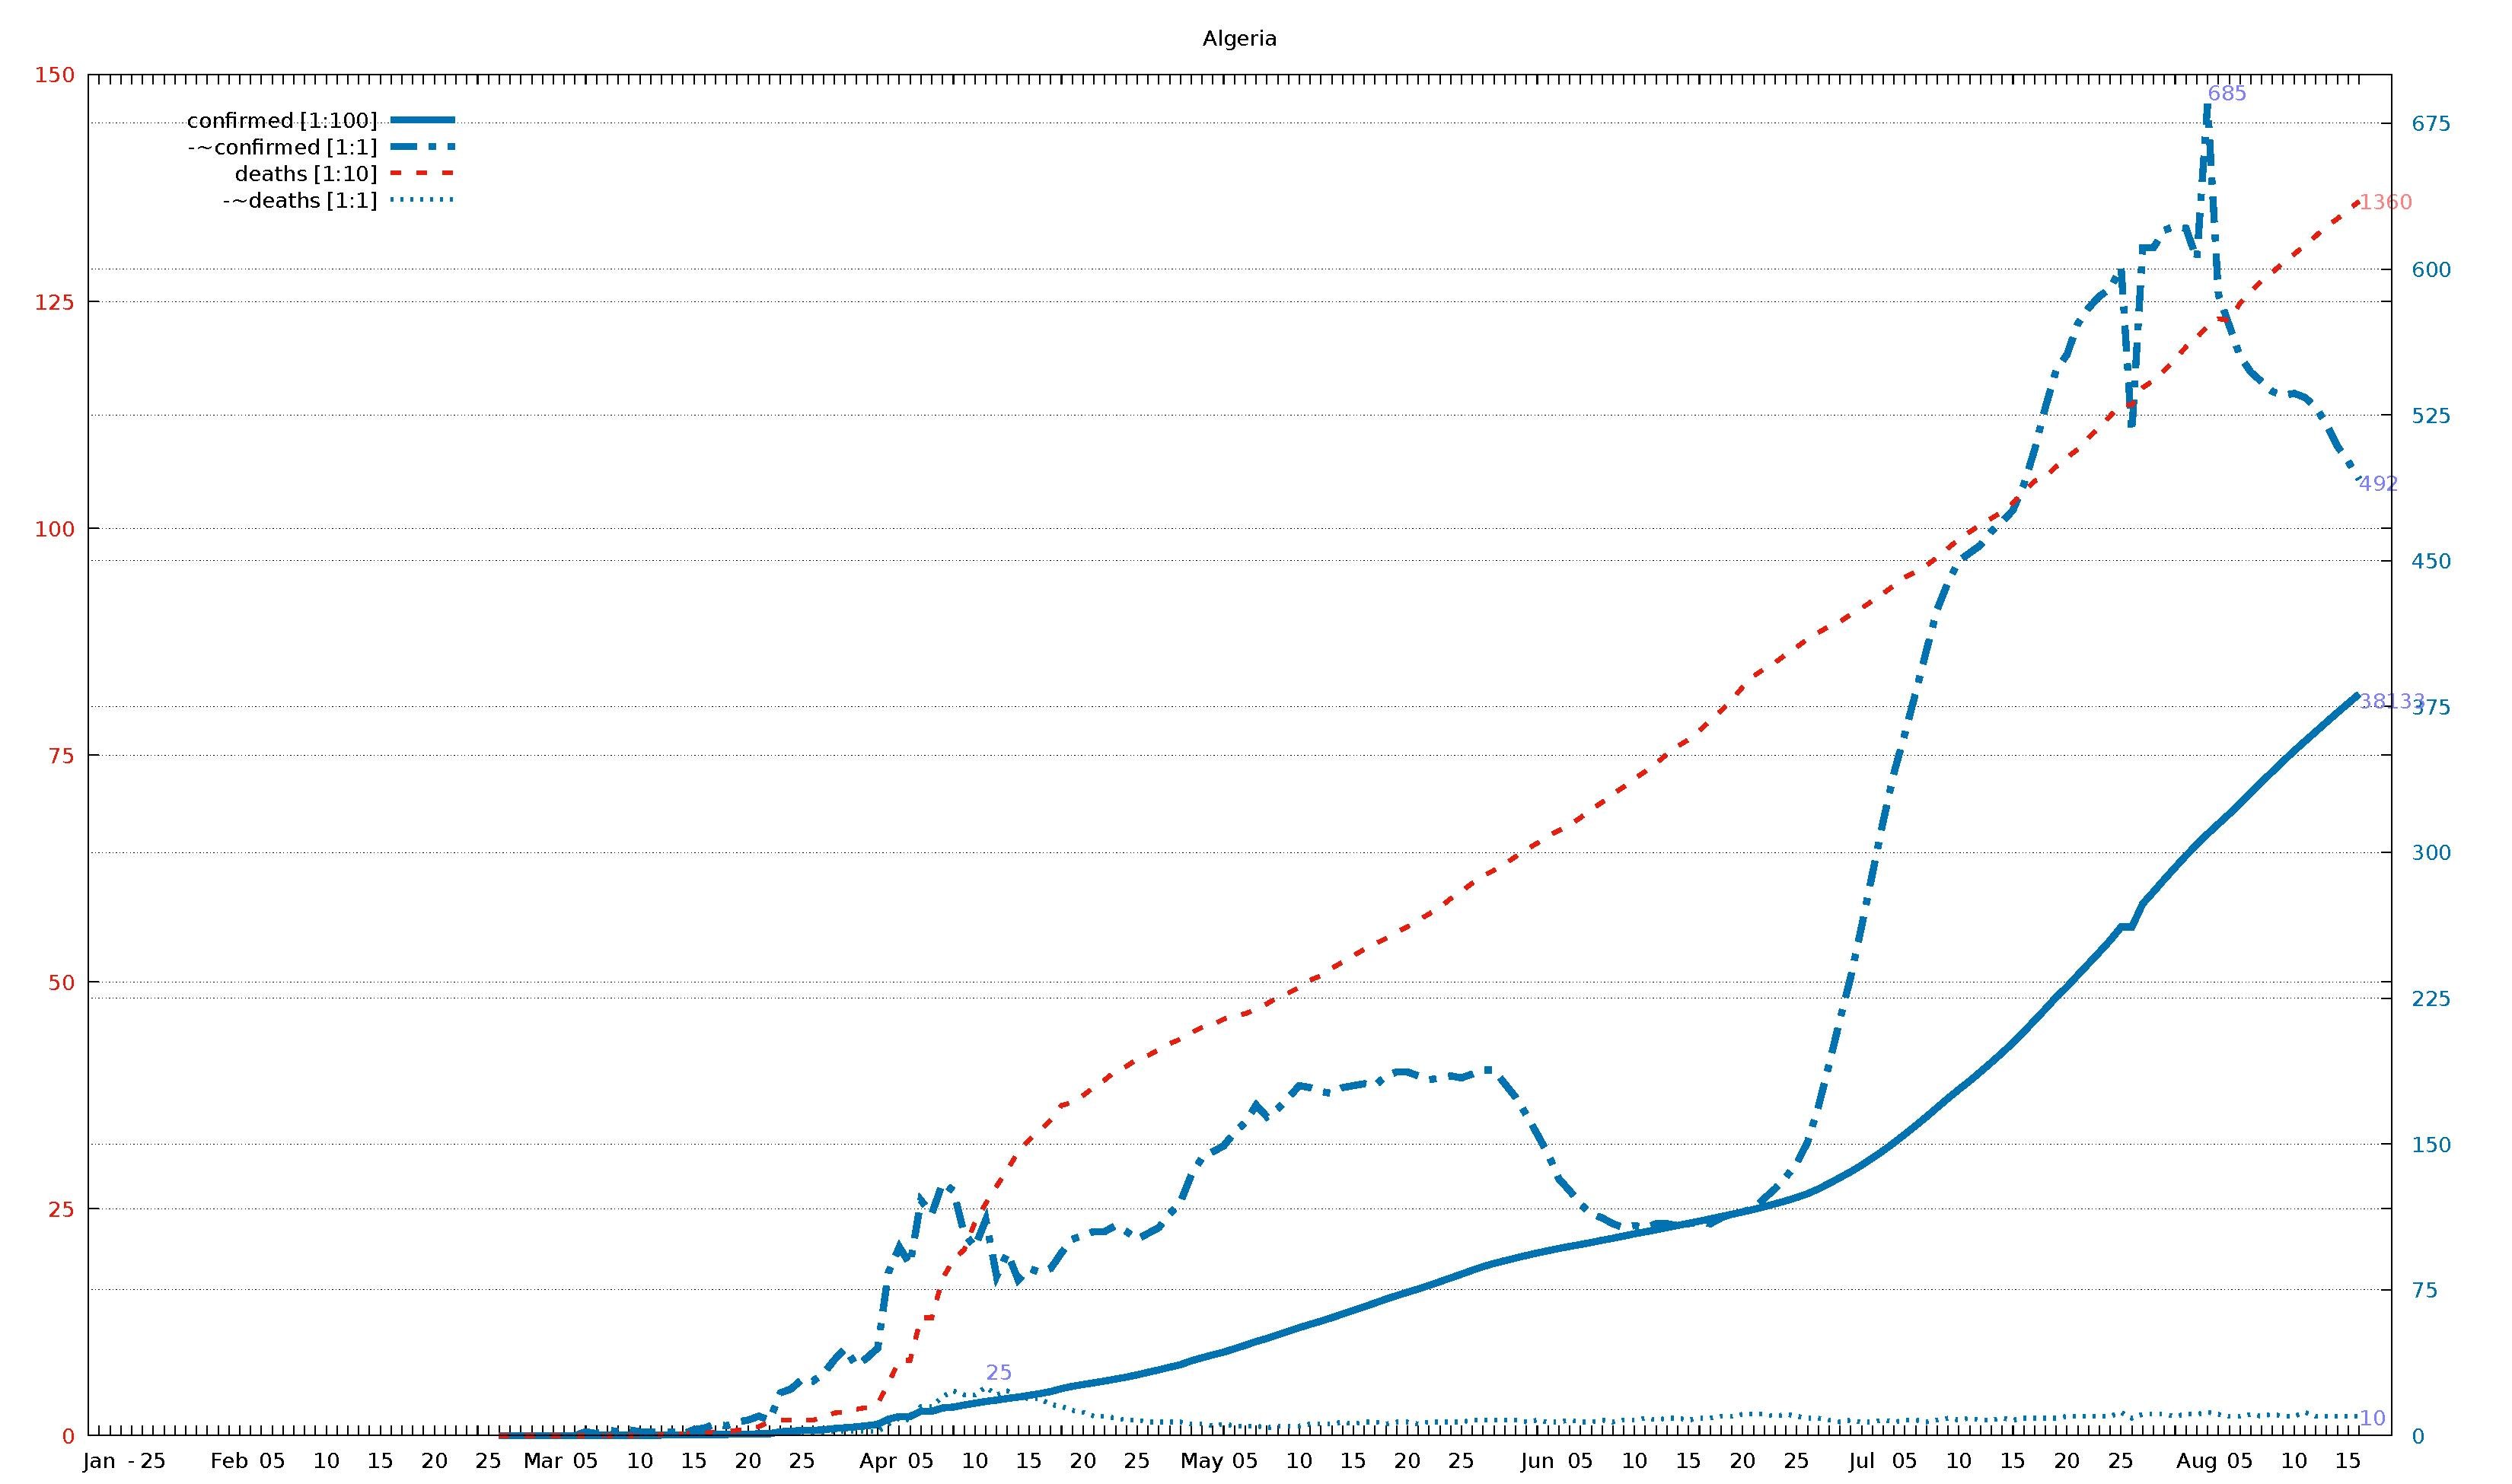
English: Diagram of WHO COVID-19 daily data (20 Jan - 16 Aug 2020) for "Total Confirmed Cases" (thick solid line), its smoothed increment (thick dash-dotted line), "Total Deaths" (thin dashed line) , and its smoothed increment (thin dotted line). Figures are taken from the available situation reports. Red and blue lines refer to the left and right vertical axis, respectively; the scaling factor for each curve is given in the legend. The horizontal axis starts on 20 Jan 2020 (situation report 1), and ends on 16 Aug 2020 (situation report 209). In the smoothed curves, for each day, 1/7 of the difference of the current day's figure and the figure a week ago is shown. For example, in situation report 115 (14 May 2020) and 121 (21 May 2020), there were 8676 and 5339 Total Confirmed Cases in Afghanistan, respectively, so the thick dash-dotted line passes through 477 = (8676-5339)/7 on 21 May.
For an overview of all related visualizations, and a more detailled description, see WHO Covid diagram set#Available country diagrams Jan-Aug 2020 (daily). |
| Date | |
| Source | Own work |
| Author | Jochen Burghardt |
Licensing[edit]
I, the copyright holder of this work, hereby publish it under the following license:
This file is licensed under the Creative Commons Attribution-Share Alike 4.0 International license.
- You are free:
- to share – to copy, distribute and transmit the work
- to remix – to adapt the work
- Under the following conditions:
- attribution – You must give appropriate credit, provide a link to the license, and indicate if changes were made. You may do so in any reasonable manner, but not in any way that suggests the licensor endorses you or your use.
- share alike – If you remix, transform, or build upon the material, you must distribute your contributions under the same or compatible license as the original.
Gnuplot source code[edit]
| Gnuplot source code |
|---|
set term pdf size 22,13
set term pdf font "sans,20"
set output "WHO_Covid_C_Algeria.pdf"
set key autotitle columnhead
set termoption noenhanced
# (1) norm: 382 685 136 001
# (2) dist: 1,0:180 2,0:281 2,1:198
# (3,4) dist max: 281 2:136--0:382
# (4) right: 1 1 0 1
# (6,7) scMax: 150 700
# (8) scale: [1:100] [1:1] [1:10] [1:1]


set xrange [-1:212]
set yrange [0:150]
set y2range [0:700]
set xtics 3650,100
set ytics 25 textcolor "#e51e10"
set y2tics 75 textcolor "#0072b2"
set grid y y2

set title "Algeria"

$data <<EOF
rep day "confirmed [1:100]" "-~confirmed [1:1]" "deaths [1:10]" "-~deaths [1:1]"
1	Jan	.	-	.	-
2	""	.	-	.	-
3	""	.	-	.	-
-	-	-	-	-	-
4	""	.	-	.	-
5	25	.	-	.	-
6	""	.	-	.	-
7	""	.	-	.	-
8	""	.	-	.	-
9	""	.	-	.	-
10	""	.	-	.	-
11	""	.	-	.	-
12	Feb	.	-	.	-
13	""	.	-	.	-
14	""	.	-	.	-
15	""	.	-	.	-
16	05	.	-	.	-
17	""	.	-	.	-
18	""	.	-	.	-
19	""	.	-	.	-
20	""	.	-	.	-
21	10	.	-	.	-
22	""	.	-	.	-
23	""	.	-	.	-
24	""	.	-	.	-
25	""	.	-	.	-
26	15	.	-	.	-
27	""	.	-	.	-
28	""	.	-	.	-
29	""	.	-	.	-
30	""	.	-	.	-
31	20	.	-	.	-
32	""	.	-	.	-
33	""	.	-	.	-
34	""	.	-	.	-
35	""	.	-	.	-
36	25	.	-	.	-
37	""	1	-	0	-
38	""	1	-	0	-
39	""	1	-	0	-
40	""	1	-	0	-
41	Mar	1	-	0	-
42	""	1	-	0	-
43	""	5	-	0	-
44	""	5	0	0	0
45	05	12	2	0	0
46	""	12	1	0	0
47	""	17	3	0	0
48	""	17	2	0	0
49	""	20	3	0	0
50	10	20	2	0	0
51	""	20	2	0	0
52	""	25	2	1	0
53	""	25	2	1	0
54	""	26	1	2	1
55	15	37	3	3	0
56	""	49	4	3	0
57	""	60	6	4	1
58	""	60	5	4	1
59	""	72	7	6	0
60	20	82	8	7	1
61	""	94	10	10	1
62	""	94	8	15	2
63	""	201	22	17	2
64	""	231	24	17	2
65	25	264	29	17	2
66	""	264	28	17	1
67	""	305	32	21	2
68	""	367	39	25	2
69	""	409	45	26	2
70	""	454	36	29	2
71	""	511	40	31	2
72	Apr	584	45	35	2
73	""	847	84	58	6
74	""	986	97	83	9
75	""	986	88	83	8
76	05	1251	121	130	15
77	""	1251	114	130	15
78	""	1423	130	173	20
79	""	1468	126	194	23
80	""	1572	104	205	21
81	10	1666	97	235	21
82	""	1761	111	256	25
83	""	1825	82	275	21
84	""	1914	94	293	23
85	""	1983	80	313	20
86	15	2070	86	326	19
87	""	2160	84	336	19
88	""	2268	86	348	16
89	""	2418	94	364	15
90	""	2534	101	367	13
91	20	2629	103	375	12
92	""	2718	105	384	10
93	""	2811	105	392	10
94	""	2910	108	402	9
95	""	3007	105	407	8
96	25	3127	101	415	8
97	""	3256	104	419	7
98	""	3382	107	425	7
99	""	3517	114	432	7
100	""	3649	120	437	7
101	""	3848	134	444	6
102	May	4006	143	450	6
103	""	4154	146	453	5
104	""	4295	149	459	6
105	""	4474	156	463	5
106	05	4648	161	465	5
107	""	4838	170	470	5
108	""	4997	164	476	4
109	""	5182	168	483	5
110	""	5369	174	488	5
111	10	5558	180	494	5
112	""	5723	179	502	6
113	""	5891	177	507	6
114	""	6067	176	515	6
115	""	6253	179	522	7
116	15	6442	180	529	6
117	""	6630	181	536	7
118	""	6821	180	542	7
119	""	7019	185	548	6
120	""	7201	187	555	7
121	20	7377	187	561	7
122	""	7542	185	568	6
123	""	7728	183	575	7
124	""	7918	184	582	7
125	""	8113	185	592	7
126	25	8306	184	600	7
127	""	8503	186	609	8
128	""	8697	188	617	8
129	""	8857	188	623	8
130	""	8997	181	630	8
131	""	9134	174	638	8
132	""	9267	165	646	7
133	Jun	9394	155	653	8
134	""	9513	145	661	7
135	""	9626	132	667	7
136	""	9733	126	673	8
137	05	9831	119	681	7
138	""	9935	114	690	7
139	""	10050	112	698	8
140	""	10154	109	707	7
141	""	10265	107	715	8
142	10	10382	108	724	8
143	""	10484	107	732	9
144	""	10589	109	741	8
145	""	10698	109	751	9
146	""	10810	108	760	9
147	15	10919	109	767	8
148	""	11031	110	777	9
149	""	11147	109	788	9
150	""	11268	112	799	10
151	""	11385	114	811	10
152	20	11504	115	825	11
153	""	11631	117	837	11
154	""	11771	122	845	11
155	""	11920	127	852	10
156	""	12076	133	861	11
157	25	12248	140	869	10
158	""	12445	151	878	9
159	""	12685	169	885	9
160	""	12968	191	892	8
161	""	13273	214	897	7
162	""	13571	236	905	8
163	Jul	13907	262	912	7
164	""	14272	289	920	7
165	""	14657	316	928	8
166	""	15070	341	937	7
167	05	15500	361	946	8
168	""	15941	382	952	8
169	""	16404	404	959	7
170	""	16879	425	968	8
171	""	17348	439	978	9
172	10	17808	450	988	8
173	""	18242	454	996	9
174	""	18712	458	1004	8
175	""	19195	465	1011	8
176	""	19689	470	1018	9
177	15	20216	476	1028	8
178	""	20770	489	1040	9
179	""	21355	507	1052	9
180	""	21948	529	1057	9
181	""	22549	548	1068	9
182	20	23084	556	1078	10
183	""	23691	572	1087	10
184	""	24278	580	1100	10
185	""	24872	586	1111	10
186	""	25484	590	1124	10
187	25	26159	601	1136	12
188	""	26159	516	1136	9
189	""	27357	611	1155	11
190	""	27973	611	1163	11
191	""	28615	620	1174	11
192	""	29229	622	1186	10
193	""	29831	621	1200	11
194	Aug	30394	605	1210	11
195	""	30950	685	1223	12
196	""	31465	587	1231	11
197	""	31972	571	1229	10
198	05	32504	555	1248	10
199	""	33055	547	1261	11
200	""	33626	542	1273	10
201	""	34155	537	1282	11
202	""	34693	535	1293	10
203	10	35214	536	1302	10
204	""	35712	534	1312	12
205	""	36204	529	1322	10
206	""	36699	520	1333	10
207	""	37187	509	1341	10
208	15	37664	501	1351	10
209	""	38133	492	1360	10
EOF

# confirmed:
set label "38133  " at first 209,381*150/700   left back textcolor "#8080ff"
# -~confirmed:
set label "492    " at first 209,492*150/700   left back textcolor "#8080ff"
set label "685    " at first 195,685*150/700+2 left back textcolor "#8080ff"
# deaths:
set label "1360   " at first 209,136           left back textcolor "#ff8080"
# -~deaths:
set label "10     " at first 209, 10*150/700   left back textcolor "#8080ff"
set label "25     " at first  82, 25*150/700+2 left back textcolor "#8080ff"

set multiplot
  plot $data using 0:($3/    100*150/700) with lines lc 6 lw 8 dt 1 title at 0.150, 0.920
replot $data using 0:($4/      1*150/700) with lines lc 6 lw 8 dt 4 title at 0.150, 0.902
replot $data using 0:($5/     10        ) with lines lc 7 lw 5 dt 2 title at 0.150, 0.884
replot $data using 0:($6/      1*150/700) with lines lc 6 lw 5 dt 3 title at 0.150, 0.866

# plot hor axis calendar
replot $data using 0:(0):xticlabel(2) with lines
|
File history
Click on a date/time to view the file as it appeared at that time.
| Date/Time | Thumbnail | Dimensions | User | Comment | |
|---|---|---|---|---|---|
| current | 18:46, 24 September 2020 |  | 3,300 × 1,950 (24 KB) | Jochen Burghardt (talk | contribs) | =={{int:filedesc}}== {{Information |description={{en|1=Diagram of WHO COVID-19 daily data (20 Jan - 16 Aug 2020) for ''"Total Confirmed Cases"'' (thick solid line), its smoothed increment (thick dash-dotted line), ''"Total Deaths"'' (thin dashed line), and its smoothed increment (thin dotted line); see File:WHO_Covid_2020_Jan-Aug_daily_C_Afghanistan.pdf for details.}} |date=2020-09-24 |source={{own}} |author=Jochen Burghardt |permission= |other_versions=[[:File:... |
You cannot overwrite this file.
File usage on Commons
There are no pages that use this file.