File:WHO Covid 2020 Jan-Aug daily C Austria.pdf
Jump to navigation
Jump to search

Size of this JPG preview of this PDF file: 800 × 473 pixels. Other resolutions: 320 × 189 pixels | 640 × 378 pixels | 1,024 × 605 pixels | 1,280 × 756 pixels | 3,300 × 1,950 pixels.
Original file (3,300 × 1,950 pixels, file size: 24 KB, MIME type: application/pdf)
Captions
Captions
Add a one-line explanation of what this file represents
Summary[edit]
| Description |
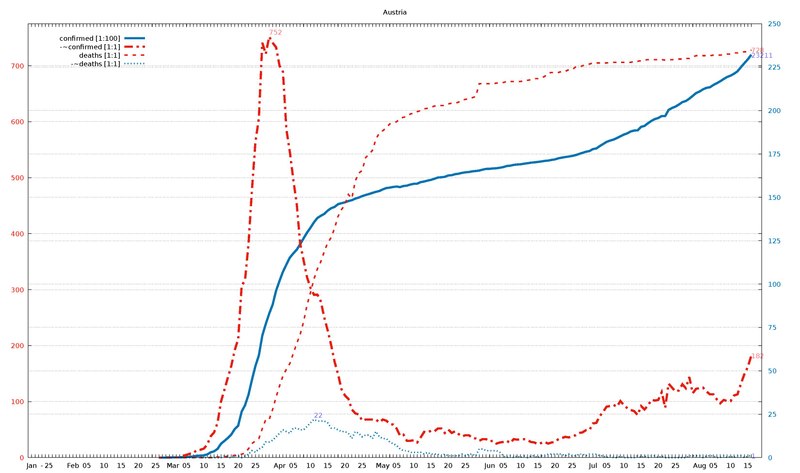
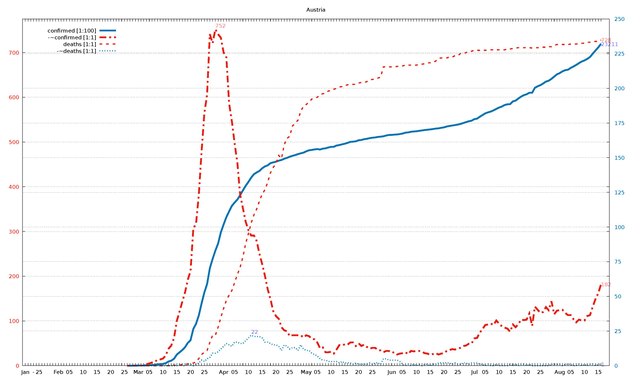
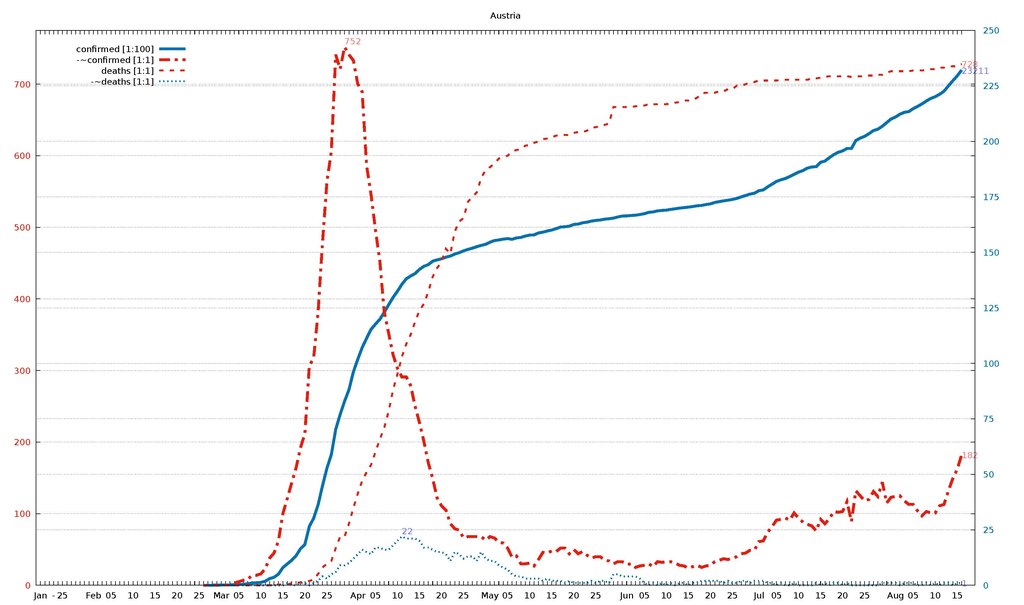
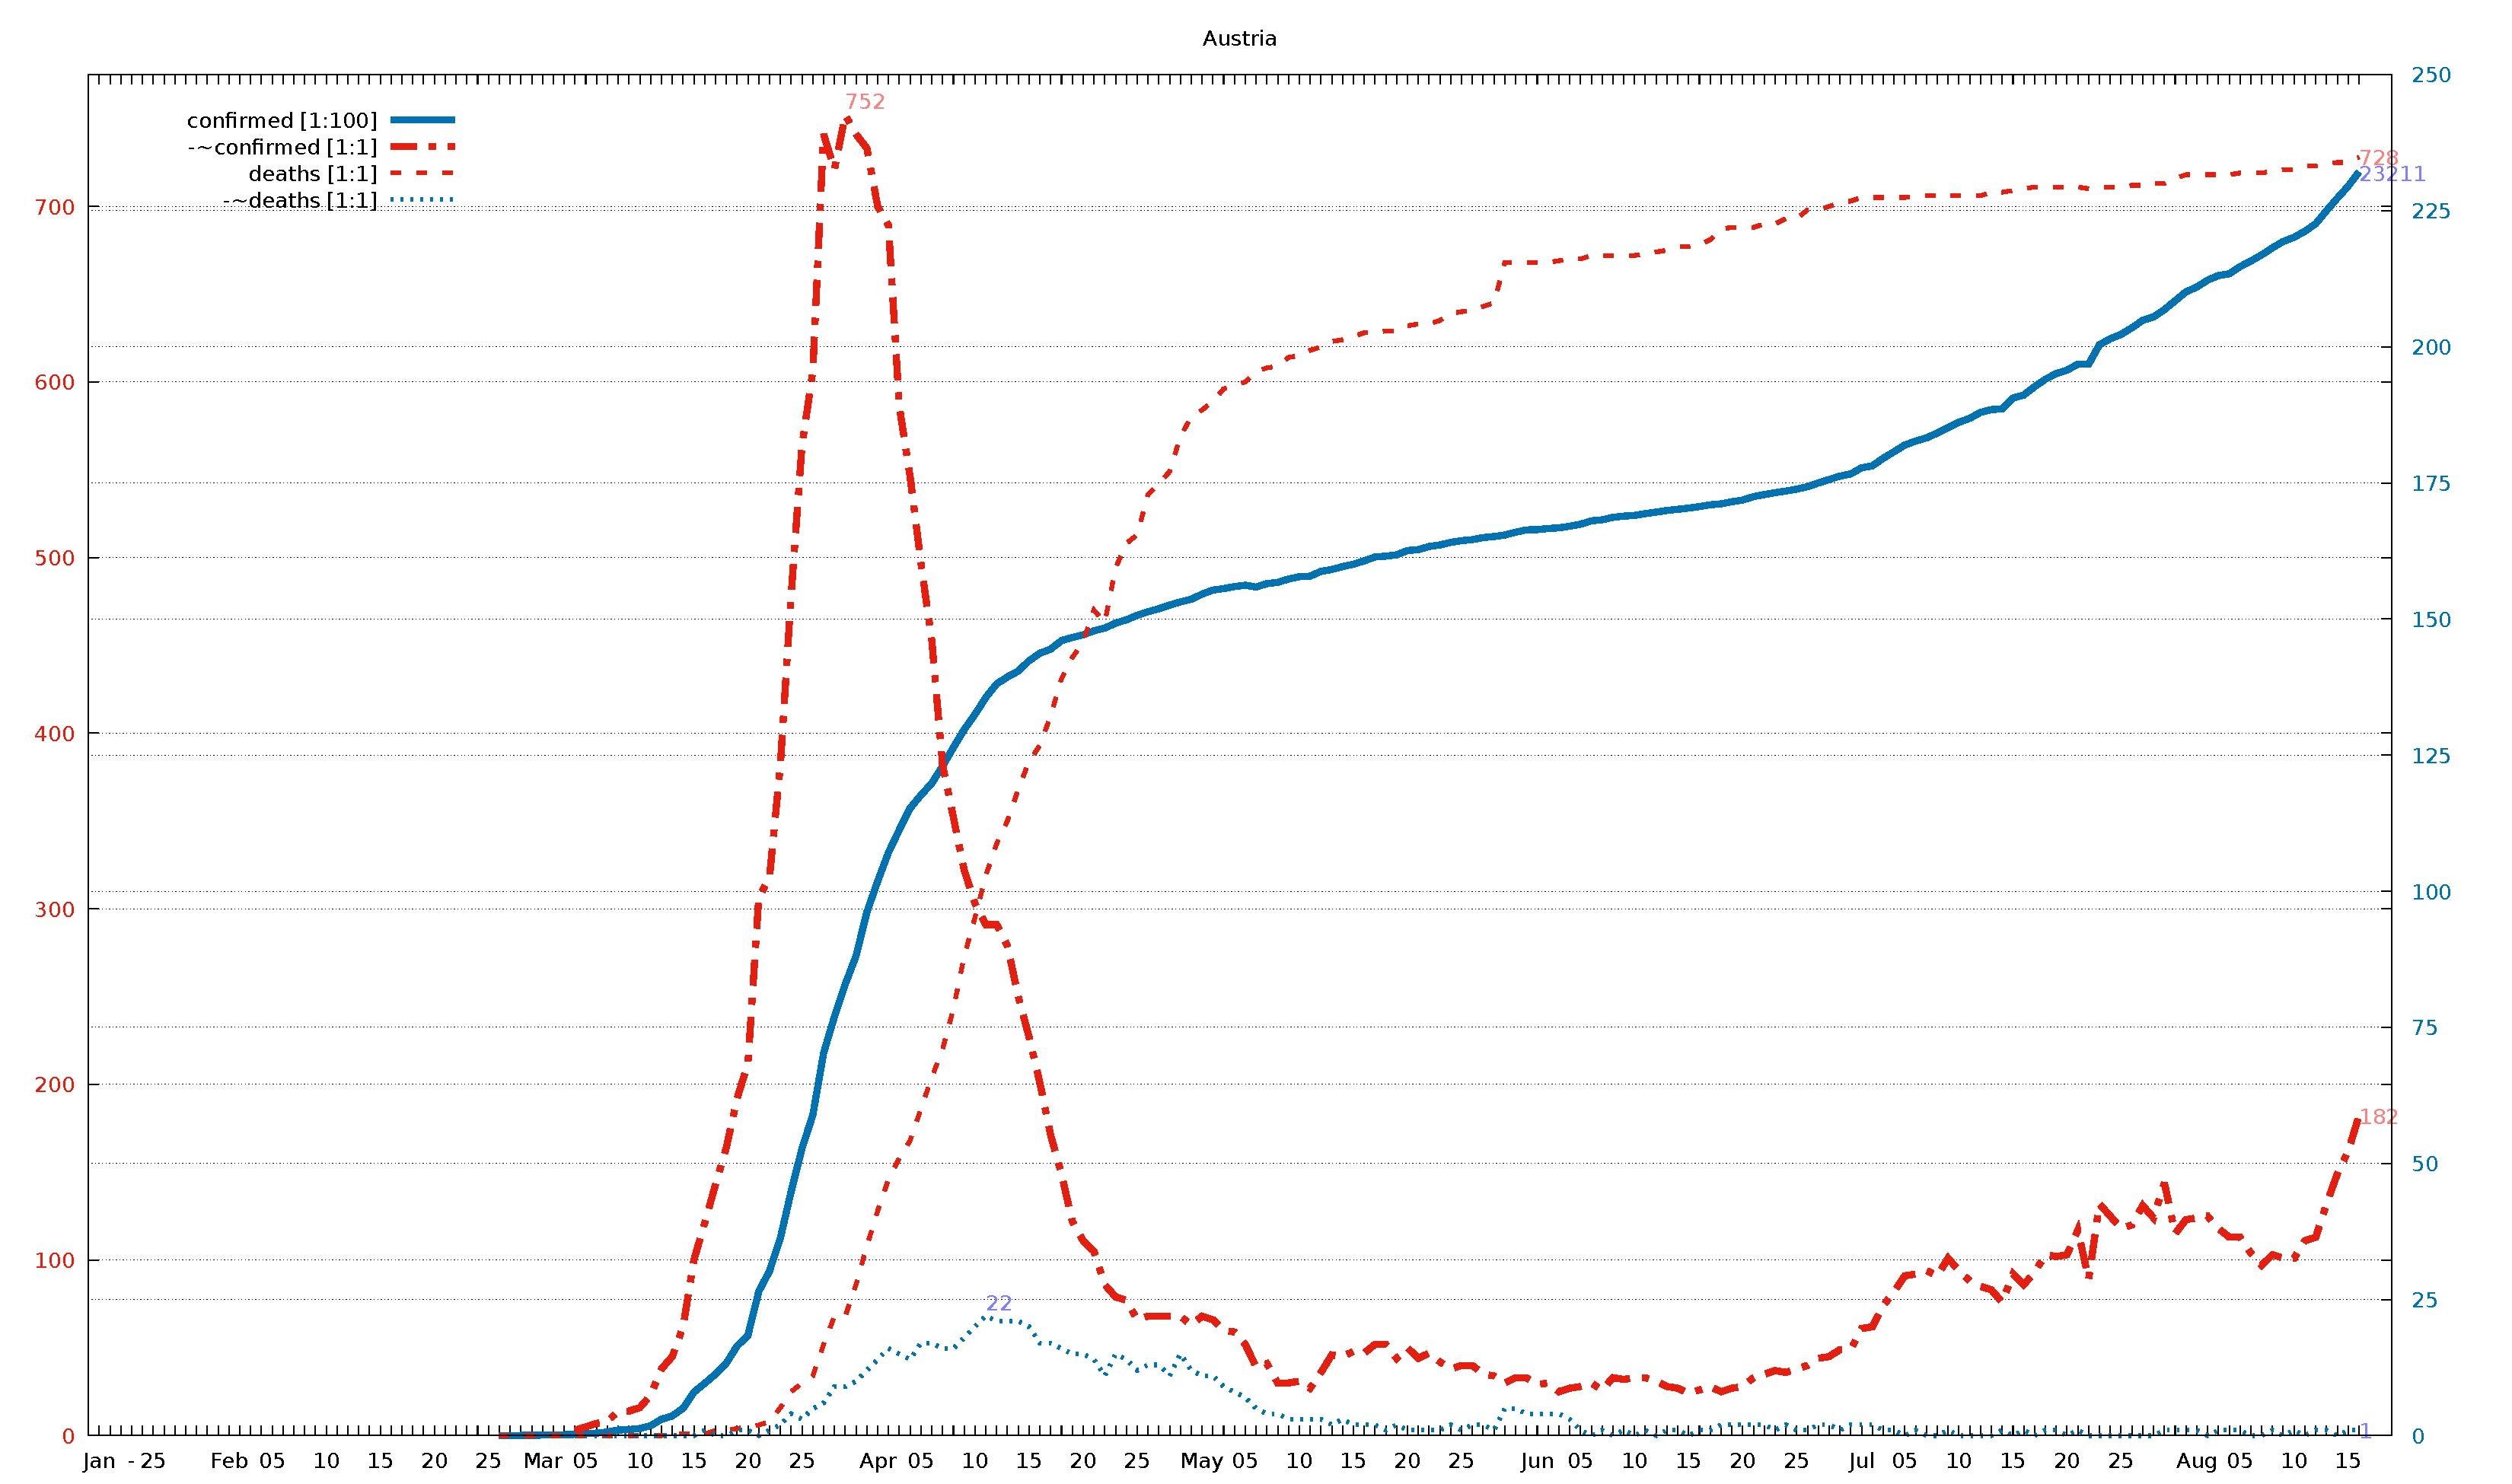
English: Diagram of WHO COVID-19 daily data (20 Jan - 16 Aug 2020) for "Total Confirmed Cases" (thick solid line), its smoothed increment (thick dash-dotted line), "Total Deaths" (thin dashed line) , and its smoothed increment (thin dotted line). Figures are taken from the available situation reports. Red and blue lines refer to the left and right vertical axis, respectively; the scaling factor for each curve is given in the legend. The horizontal axis starts on 20 Jan 2020 (situation report 1), and ends on 16 Aug 2020 (situation report 209). In the smoothed curves, for each day, 1/7 of the difference of the current day's figure and the figure a week ago is shown. For example, in situation report 115 (14 May 2020) and 121 (21 May 2020), there were 8676 and 5339 Total Confirmed Cases in Afghanistan, respectively, so the thick dash-dotted line passes through 477 = (8676-5339)/7 on 21 May.
For an overview of all related visualizations, and a more detailled description, see WHO Covid diagram set#Available country diagrams Jan-Aug 2020 (daily). |
| Date | |
| Source | Own work |
| Author | Jochen Burghardt |
Licensing[edit]
I, the copyright holder of this work, hereby publish it under the following license:
This file is licensed under the Creative Commons Attribution-Share Alike 4.0 International license.
- You are free:
- to share – to copy, distribute and transmit the work
- to remix – to adapt the work
- Under the following conditions:
- attribution – You must give appropriate credit, provide a link to the license, and indicate if changes were made. You may do so in any reasonable manner, but not in any way that suggests the licensor endorses you or your use.
- share alike – If you remix, transform, or build upon the material, you must distribute your contributions under the same or compatible license as the original.
Gnuplot source code[edit]
| Gnuplot source code |
|---|
set term pdf size 22,13
set term pdf font "sans,20"
set output "WHO_Covid_C_Austria.pdf"
set key autotitle columnhead
set termoption noenhanced
# (1) norm: 233 752 728 001
# (2) dist: 1,0:309 2,0:313 2,1:104
# (3,4) dist max: 313 2:728--0:233
# (4) right: 1 0 0 1
# (6,7) scMax: 775 250
# (8) scale: [1:100] [1:1] [1:1] [1:1]


set xrange [-1:212]
set yrange [0:775]
set y2range [0:250]
set xtics 3650,100
set ytics 100 textcolor "#e51e10"
set y2tics 25 textcolor "#0072b2"
set grid y y2

set title "Austria"

$data <<EOF
rep day "confirmed [1:100]" "-~confirmed [1:1]" "deaths [1:1]" "-~deaths [1:1]"
1	Jan	.	-	.	-
2	""	.	-	.	-
3	""	.	-	.	-
-	-	-	-	-	-
4	""	.	-	.	-
5	25	.	-	.	-
6	""	.	-	.	-
7	""	.	-	.	-
8	""	.	-	.	-
9	""	.	-	.	-
10	""	.	-	.	-
11	""	.	-	.	-
12	Feb	.	-	.	-
13	""	.	-	.	-
14	""	.	-	.	-
15	""	.	-	.	-
16	05	.	-	.	-
17	""	.	-	.	-
18	""	.	-	.	-
19	""	.	-	.	-
20	""	.	-	.	-
21	10	.	-	.	-
22	""	.	-	.	-
23	""	.	-	.	-
24	""	.	-	.	-
25	""	.	-	.	-
26	15	.	-	.	-
27	""	.	-	.	-
28	""	.	-	.	-
29	""	.	-	.	-
30	""	.	-	.	-
31	20	.	-	.	-
32	""	.	-	.	-
33	""	.	-	.	-
34	""	.	-	.	-
35	""	.	-	.	-
36	25	.	-	.	-
37	""	2	-	0	-
38	""	2	-	0	-
39	""	4	-	0	-
40	""	5	-	0	-
41	Mar	10	-	0	-
42	""	10	-	0	-
43	""	18	-	0	-
44	""	24	3	0	0
45	05	37	5	0	0
46	""	47	7	0	0
47	""	66	8	0	0
48	""	104	14	0	0
49	""	112	14	0	0
50	10	131	16	0	0
51	""	182	23	0	0
52	""	302	38	0	0
53	""	361	45	1	0
54	""	504	62	1	0
55	15	800	100	1	0
56	""	959	121	1	1
57	""	1132	143	3	0
58	""	1332	164	3	0
59	""	1646	192	4	1
60	20	1843	212	5	1
61	""	2649	306	6	0
62	""	3024	318	8	1
63	""	3631	382	16	2
64	""	4486	479	25	4
65	25	5282	564	30	3
66	""	5888	606	34	5
67	""	7029	741	52	6
68	""	7697	721	68	9
69	""	8291	752	68	9
70	""	8813	741	86	10
71	""	9618	733	108	12
72	Apr	10182	700	128	14
73	""	10711	689	146	16
74	""	11129	586	158	15
75	""	11525	546	168	14
76	05	11766	497	186	17
77	""	11983	453	204	17
78	""	12297	382	220	16
79	""	12640	352	243	16
80	""	12969	322	273	18
81	10	13248	303	295	20
82	""	13560	291	319	22
83	""	13807	291	337	21
84	""	13937	279	350	21
85	""	14043	250	368	21
86	15	14234	227	384	20
87	""	14370	201	393	17
88	""	14448	171	410	17
89	""	14603	149	431	16
90	""	14662	122	443	15
91	20	14710	111	452	15
92	""	14783	105	470	14
93	""	14833	86	463	11
94	""	14924	79	494	15
95	""	14985	77	508	14
96	25	15068	66	513	12
97	""	15134	68	536	13
98	""	15189	68	542	13
99	""	15256	68	549	11
100	""	15314	68	569	15
101	""	15364	63	580	12
102	May	15457	68	584	11
103	""	15531	66	589	11
104	""	15558	60	596	9
105	""	15597	59	598	8
106	05	15621	52	600	7
107	""	15586	39	606	5
108	""	15651	41	608	4
109	""	15673	30	609	4
110	""	15735	30	614	3
111	10	15777	31	615	3
112	""	15787	27	618	3
113	""	15874	36	620	3
114	""	15910	46	623	2
115	""	15964	45	624	3
116	15	16005	48	626	2
117	""	16068	47	628	2
118	""	16140	52	628	2
119	""	16154	52	629	1
120	""	16179	44	629	2
121	20	16257	50	632	1
122	""	16275	44	633	1
123	""	16332	47	633	1
124	""	16361	42	635	1
125	""	16407	38	639	2
126	25	16439	40	640	1
127	""	16459	40	641	2
128	""	16497	35	643	2
129	""	16515	34	645	1
130	""	16543	30	668	5
131	""	16594	33	668	5
132	""	16638	33	668	4
133	Jun	16642	29	668	4
134	""	16663	30	668	4
135	""	16674	25	669	4
136	""	16705	27	670	3
137	05	16741	28	670	1
138	""	16803	30	672	0
139	""	16822	26	672	1
140	""	16868	33	672	0
141	""	16889	32	672	1
142	10	16902	33	672	0
143	""	16936	33	673	1
144	""	16964	31	674	0
145	""	16994	28	675	1
146	""	17014	27	677	1
147	15	17038	24	677	0
148	""	17065	26	678	1
149	""	17098	28	681	1
150	""	17115	25	687	2
151	""	17155	27	688	2
152	20	17185	28	688	2
153	""	17247	33	688	2
154	""	17285	35	690	2
155	""	17320	37	690	1
156	""	17351	36	693	2
157	25	17384	38	693	1
158	""	17431	40	698	1
159	""	17498	44	698	2
160	""	17562	45	700	2
161	""	17625	49	702	1
162	""	17666	49	703	2
163	Jul	17777	61	705	2
164	""	17814	62	705	2
165	""	17952	74	705	1
166	""	18073	82	705	1
167	05	18196	91	705	0
168	""	18269	92	706	1
169	""	18326	94	706	0
170	""	18415	91	706	0
171	""	18516	101	706	1
172	10	18613	94	706	0
173	""	18687	88	706	0
174	""	18795	85	706	0
175	""	18847	83	708	0
176	""	18859	76	708	1
177	15	19060	92	709	0
178	""	19115	86	710	1
179	""	19268	93	711	0
180	""	19406	103	711	1
181	""	19508	102	711	1
182	20	19571	103	711	0
183	""	19679	117	711	1
184	""	19679	89	710	0
185	""	20038	132	711	0
186	""	20148	125	711	0
187	25	20229	118	711	0
188	""	20349	120	712	0
189	""	20486	131	712	0
190	""	20550	124	713	0
191	""	20682	144	713	1
192	""	20846	115	716	1
193	""	21009	123	718	1
194	Aug	21098	124	718	1
195	""	21224	125	718	0
196	""	21309	118	718	1
197	""	21341	113	718	1
198	05	21472	113	719	1
199	""	21575	104	719	0
200	""	21689	97	719	0
201	""	21819	103	720	1
202	""	21935	101	721	0
203	10	22011	101	721	1
204	""	22122	111	723	0
205	""	22260	113	723	1
206	""	22501	132	724	1
207	""	22730	149	725	0
208	15	22951	162	725	1
209	""	23211	182	728	1
EOF

# confirmed:
set label "23211  " at first 209,232*775/250   left back textcolor "#8080ff"
# -~confirmed:
set label "182    " at first 209,182           left back textcolor "#ff8080"
set label "752    " at first  69,752        +8 left back textcolor "#ff8080"
# deaths:
set label "728    " at first 209,728           left back textcolor "#ff8080"
# -~deaths:
set label "1      " at first 209,  1*775/250   left back textcolor "#8080ff"
set label "22     " at first  82, 22*775/250+8 left back textcolor "#8080ff"

set multiplot
  plot $data using 0:($3/    100*775/250) with lines lc 6 lw 8 dt 1 title at 0.150, 0.920
replot $data using 0:($4/      1        ) with lines lc 7 lw 8 dt 4 title at 0.150, 0.902
replot $data using 0:($5/      1        ) with lines lc 7 lw 5 dt 2 title at 0.150, 0.884
replot $data using 0:($6/      1*775/250) with lines lc 6 lw 5 dt 3 title at 0.150, 0.866

# plot hor axis calendar
replot $data using 0:(0):xticlabel(2) with lines
|
File history
Click on a date/time to view the file as it appeared at that time.
| Date/Time | Thumbnail | Dimensions | User | Comment | |
|---|---|---|---|---|---|
| current | 18:48, 24 September 2020 |  | 3,300 × 1,950 (24 KB) | Jochen Burghardt (talk | contribs) | =={{int:filedesc}}== {{Information |description={{en|1=Diagram of WHO COVID-19 daily data (20 Jan - 16 Aug 2020) for ''"Total Confirmed Cases"'' (thick solid line), its smoothed increment (thick dash-dotted line), ''"Total Deaths"'' (thin dashed line), and its smoothed increment (thin dotted line); see File:WHO_Covid_2020_Jan-Aug_daily_C_Afghanistan.pdf for details.}} |date=2020-09-24 |source={{own}} |author=Jochen Burghardt |permission= |other_versions=[[:File:... |
You cannot overwrite this file.
File usage on Commons
There are no pages that use this file.