File:WHO Covid 2020 Jan-Aug daily C Bahrain.pdf
Jump to navigation
Jump to search

Size of this JPG preview of this PDF file: 800 × 473 pixels. Other resolutions: 320 × 189 pixels | 640 × 378 pixels | 1,024 × 605 pixels | 1,280 × 756 pixels | 3,300 × 1,950 pixels.
Original file (3,300 × 1,950 pixels, file size: 23 KB, MIME type: application/pdf)
Captions
Captions
Add a one-line explanation of what this file represents
Summary[edit]
| Description |
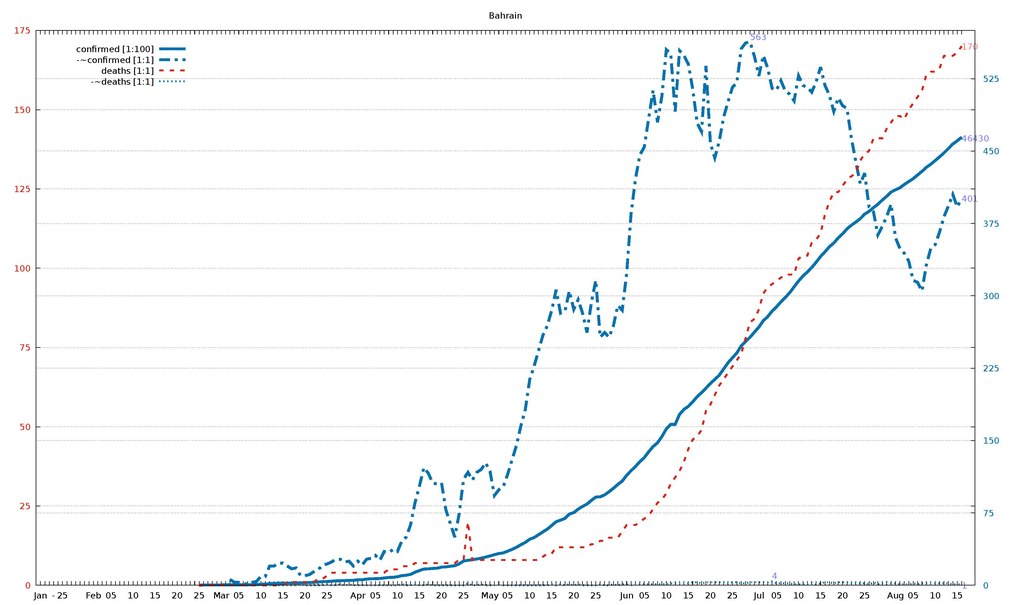
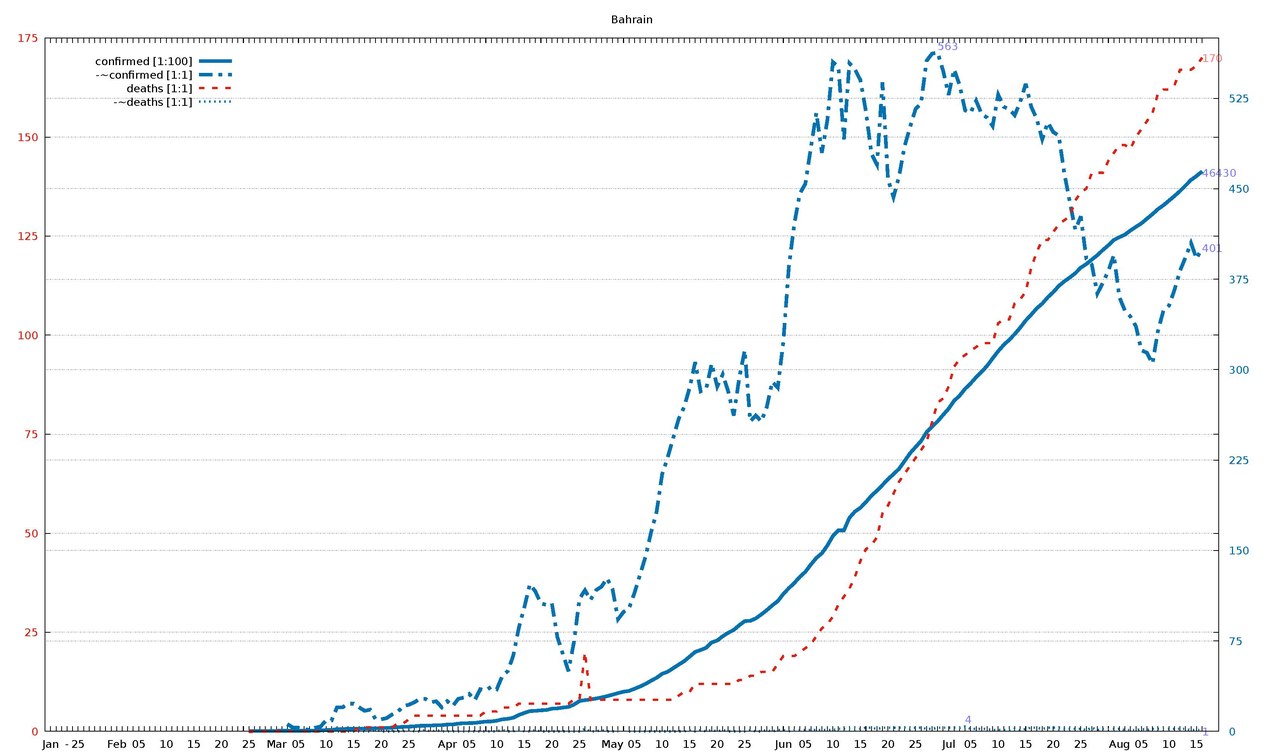
English: Diagram of WHO COVID-19 daily data (20 Jan - 16 Aug 2020) for "Total Confirmed Cases" (thick solid line), its smoothed increment (thick dash-dotted line), "Total Deaths" (thin dashed line) , and its smoothed increment (thin dotted line). Figures are taken from the available situation reports. Red and blue lines refer to the left and right vertical axis, respectively; the scaling factor for each curve is given in the legend. The horizontal axis starts on 20 Jan 2020 (situation report 1), and ends on 16 Aug 2020 (situation report 209). In the smoothed curves, for each day, 1/7 of the difference of the current day's figure and the figure a week ago is shown. For example, in situation report 115 (14 May 2020) and 121 (21 May 2020), there were 8676 and 5339 Total Confirmed Cases in Afghanistan, respectively, so the thick dash-dotted line passes through 477 = (8676-5339)/7 on 21 May.
For an overview of all related visualizations, and a more detailled description, see WHO Covid diagram set#Available country diagrams Jan-Aug 2020 (daily). |
| Date | |
| Source | Own work |
| Author | Jochen Burghardt |
Licensing[edit]
I, the copyright holder of this work, hereby publish it under the following license:
This file is licensed under the Creative Commons Attribution-Share Alike 4.0 International license.
- You are free:
- to share – to copy, distribute and transmit the work
- to remix – to adapt the work
- Under the following conditions:
- attribution – You must give appropriate credit, provide a link to the license, and indicate if changes were made. You may do so in any reasonable manner, but not in any way that suggests the licensor endorses you or your use.
- share alike – If you remix, transform, or build upon the material, you must distribute your contributions under the same or compatible license as the original.
Gnuplot source code[edit]
| Gnuplot source code |
|---|
set term pdf size 22,13
set term pdf font "sans,20"
set output "WHO_Covid_C_Bahrain.pdf"
set key autotitle columnhead
set termoption noenhanced
# (1) norm: 465 563 170 001
# (2) dist: 1,0:121 2,0:274 2,1:301
# (3,4) dist max: 301 2:170--1:563
# (4) right: 1 1 0 1
# (6,7) scMax: 175 575
# (8) scale: [1:100] [1:1] [1:1] [1:1]


set xrange [-1:212]
set yrange [0:175]
set y2range [0:575]
set xtics 3650,100
set ytics 25 textcolor "#e51e10"
set y2tics 75 textcolor "#0072b2"
set grid y y2

set title "Bahrain"

$data <<EOF
rep day "confirmed [1:100]" "-~confirmed [1:1]" "deaths [1:1]" "-~deaths [1:1]"
1	Jan	.	-	.	-
2	""	.	-	.	-
3	""	.	-	.	-
-	-	-	-	-	-
4	""	.	-	.	-
5	25	.	-	.	-
6	""	.	-	.	-
7	""	.	-	.	-
8	""	.	-	.	-
9	""	.	-	.	-
10	""	.	-	.	-
11	""	.	-	.	-
12	Feb	.	-	.	-
13	""	.	-	.	-
14	""	.	-	.	-
15	""	.	-	.	-
16	05	.	-	.	-
17	""	.	-	.	-
18	""	.	-	.	-
19	""	.	-	.	-
20	""	.	-	.	-
21	10	.	-	.	-
22	""	.	-	.	-
23	""	.	-	.	-
24	""	.	-	.	-
25	""	.	-	.	-
26	15	.	-	.	-
27	""	.	-	.	-
28	""	.	-	.	-
29	""	.	-	.	-
30	""	.	-	.	-
31	20	.	-	.	-
32	""	.	-	.	-
33	""	.	-	.	-
34	""	.	-	.	-
35	""	.	-	.	-
36	25	8	-	0	-
37	""	26	-	0	-
38	""	33	-	0	-
39	""	33	-	0	-
40	""	38	-	0	-
41	Mar	40	-	0	-
42	""	47	-	0	-
43	""	49	6	0	0
44	""	49	3	0	0
45	05	49	3	0	0
46	""	49	2	0	0
47	""	49	1	0	0
48	""	56	3	0	0
49	""	79	4	0	0
50	10	109	9	0	0
51	""	110	9	0	0
52	""	189	20	0	0
53	""	195	20	0	0
54	""	210	23	0	0
55	15	211	23	0	0
56	""	221	20	1	0
57	""	229	17	1	0
58	""	237	18	1	0
59	""	256	10	1	1
60	20	269	10	1	0
61	""	285	11	1	0
62	""	306	14	1	0
63	""	337	16	2	0
64	""	377	21	2	0
65	25	392	22	3	1
66	""	419	24	4	0
67	""	458	27	4	0
68	""	473	27	4	1
69	""	476	24	4	0
70	""	515	25	4	1
71	""	515	20	4	0
72	Apr	567	25	4	0
73	""	569	21	4	0
74	""	643	27	4	0
75	""	673	28	4	0
76	05	688	31	4	0
77	""	700	26	4	0
78	""	756	35	4	0
79	""	811	34	5	0
80	""	823	37	5	0
81	10	887	35	5	0
82	""	998	46	6	1
83	""	1040	50	6	0
84	""	1136	63	6	0
85	""	1362	86	7	1
86	15	1528	103	7	0
87	""	1677	122	7	0
88	""	1700	116	7	1
89	""	1744	106	7	0
90	""	1773	105	7	0
91	20	1881	106	7	0
92	""	1907	78	7	0
93	""	1973	64	7	0
94	""	2027	50	7	0
95	""	2217	74	8	0
96	25	2518	110	8	0
97	""	2589	117	20	2
98	""	2647	109	8	0
99	""	2723	117	8	0
100	""	2811	120	8	1
101	""	2921	127	8	0
102	May	3040	118	8	0
103	""	3170	93	8	0
104	""	3284	99	8	-2
105	""	3356	102	8	0
106	05	3533	115	8	0
107	""	3720	130	8	0
108	""	3934	145	8	0
109	""	4199	165	8	0
110	""	4444	182	8	0
111	10	4774	213	8	0
112	""	4941	227	8	0
113	""	5236	243	8	0
114	""	5531	259	9	0
115	""	5816	269	10	0
116	15	6198	285	10	1
117	""	6583	306	12	0
118	""	6747	282	12	1
119	""	6930	284	12	0
120	""	7374	305	12	1
121	20	7532	286	12	0
122	""	7888	296	12	1
123	""	8174	282	12	0
124	""	8414	262	12	0
125	""	8802	293	13	0
126	25	9138	316	13	0
127	""	9171	257	14	1
128	""	9366	262	14	0
129	""	9692	257	15	0
130	""	10052	269	15	1
131	""	10449	290	15	0
132	""	10793	285	17	1
133	Jun	11398	323	19	1
134	""	11871	385	19	0
135	""	12311	421	19	1
136	""	12815	446	20	1
137	05	13229	454	21	1
138	""	13835	484	22	1
139	""	14383	513	24	1
140	""	14763	480	26	1
141	""	15417	507	27	1
142	10	16200	555	29	1
143	""	16667	551	32	2
144	""	16667	491	34	2
145	""	17713	554	36	2
146	""	18227	549	39	2
147	15	18544	540	43	2
148	""	19013	514	46	3
149	""	19553	479	47	3
150	""	19961	470	49	2
151	""	20430	538	55	3
152	20	20916	458	57	3
153	""	21331	443	60	3
154	""	21764	460	63	3
155	""	22407	485	65	3
156	""	23062	501	67	2
157	25	23570	516	69	3
158	""	24081	521	71	3
159	""	24805	556	73	2
160	""	25267	562	78	2
161	""	25705	563	83	3
162	""	26239	548	84	3
163	Jul	26758	528	87	3
164	""	27414	549	92	3
165	""	27837	536	94	3
166	""	28410	515	95	4
167	05	28857	513	96	2
168	""	29367	523	97	2
169	""	29821	512	98	2
170	""	30321	509	98	2
171	""	30931	502	98	1
172	10	31528	528	103	1
173	""	32039	518	104	1
174	""	32470	516	104	1
175	""	32941	511	108	2
176	""	33476	522	109	1
177	15	34078	537	111	2
178	""	34560	518	117	3
179	""	35084	508	121	3
180	""	35473	491	124	2
181	""	36004	505	124	3
182	20	36422	497	126	3
183	""	36936	494	128	3
184	""	37316	463	129	2
185	""	37637	439	130	2
186	""	37996	416	134	2
187	25	38458	427	136	2
188	""	38747	392	137	1
189	""	39131	387	141	3
190	""	39482	363	141	1
191	""	39921	372	141	2
192	""	40311	382	144	2
193	""	40755	395	146	2
194	Aug	40982	360	148	2
195	""	41190	349	148	1
196	""	41536	344	147	1
197	""	41835	336	150	1
198	05	42132	316	152	2
199	""	42514	314	154	1
200	""	42889	305	156	2
201	""	43307	332	161	2
202	""	43629	349	162	2
203	10	44011	353	162	2
204	""	44397	366	163	2
205	""	44804	382	167	2
206	""	45264	393	167	2
207	""	45726	405	167	1
208	15	46052	392	168	1
209	""	46430	401	170	1
EOF

# confirmed:
set label "46430  " at first 209,464*175/575   left back textcolor "#8080ff"
# -~confirmed:
set label "401    " at first 209,401*175/575   left back textcolor "#8080ff"
set label "563    " at first 161,563*175/575+2 left back textcolor "#8080ff"
# deaths:
set label "170    " at first 209,170           left back textcolor "#ff8080"
# -~deaths:
set label "1      " at first 209,  1*175/575   left back textcolor "#8080ff"
set label "4      " at first 166,  4*175/575+2 left back textcolor "#8080ff"

set multiplot
  plot $data using 0:($3/    100*175/575) with lines lc 6 lw 8 dt 1 title at 0.150, 0.920
replot $data using 0:($4/      1*175/575) with lines lc 6 lw 8 dt 4 title at 0.150, 0.902
replot $data using 0:($5/      1        ) with lines lc 7 lw 5 dt 2 title at 0.150, 0.884
replot $data using 0:($6/      1*175/575) with lines lc 6 lw 5 dt 3 title at 0.150, 0.866

# plot hor axis calendar
replot $data using 0:(0):xticlabel(2) with lines
|
File history
Click on a date/time to view the file as it appeared at that time.
| Date/Time | Thumbnail | Dimensions | User | Comment | |
|---|---|---|---|---|---|
| current | 18:49, 24 September 2020 |  | 3,300 × 1,950 (23 KB) | Jochen Burghardt (talk | contribs) | =={{int:filedesc}}== {{Information |description={{en|1=Diagram of WHO COVID-19 daily data (20 Jan - 16 Aug 2020) for ''"Total Confirmed Cases"'' (thick solid line), its smoothed increment (thick dash-dotted line), ''"Total Deaths"'' (thin dashed line), and its smoothed increment (thin dotted line); see File:WHO_Covid_2020_Jan-Aug_daily_C_Afghanistan.pdf for details.}} |date=2020-09-24 |source={{own}} |author=Jochen Burghardt |permission= |other_versions=[[:File:... |
You cannot overwrite this file.
File usage on Commons
There are no pages that use this file.