File:WHO Covid 2020 Jan-Aug daily C Bolivia.pdf
Jump to navigation
Jump to search

Size of this JPG preview of this PDF file: 800 × 473 pixels. Other resolutions: 320 × 189 pixels | 640 × 378 pixels | 1,024 × 605 pixels | 1,280 × 756 pixels | 3,300 × 1,950 pixels.
Original file (3,300 × 1,950 pixels, file size: 24 KB, MIME type: application/pdf)
Captions
Captions
Add a one-line explanation of what this file represents
Summary[edit]
| Description |
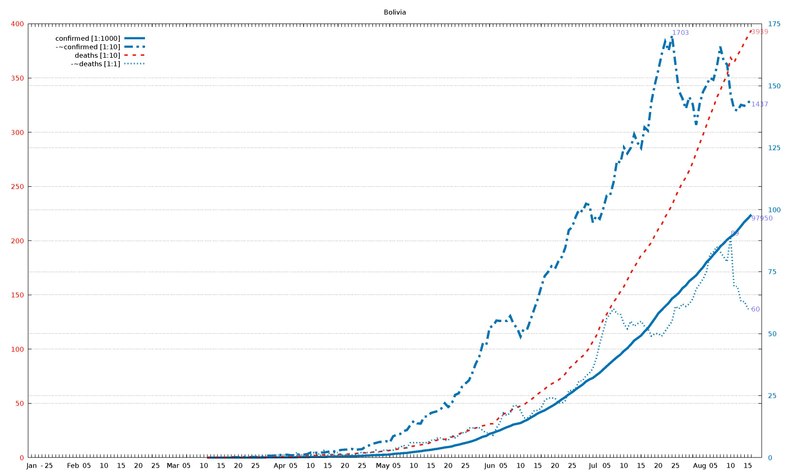
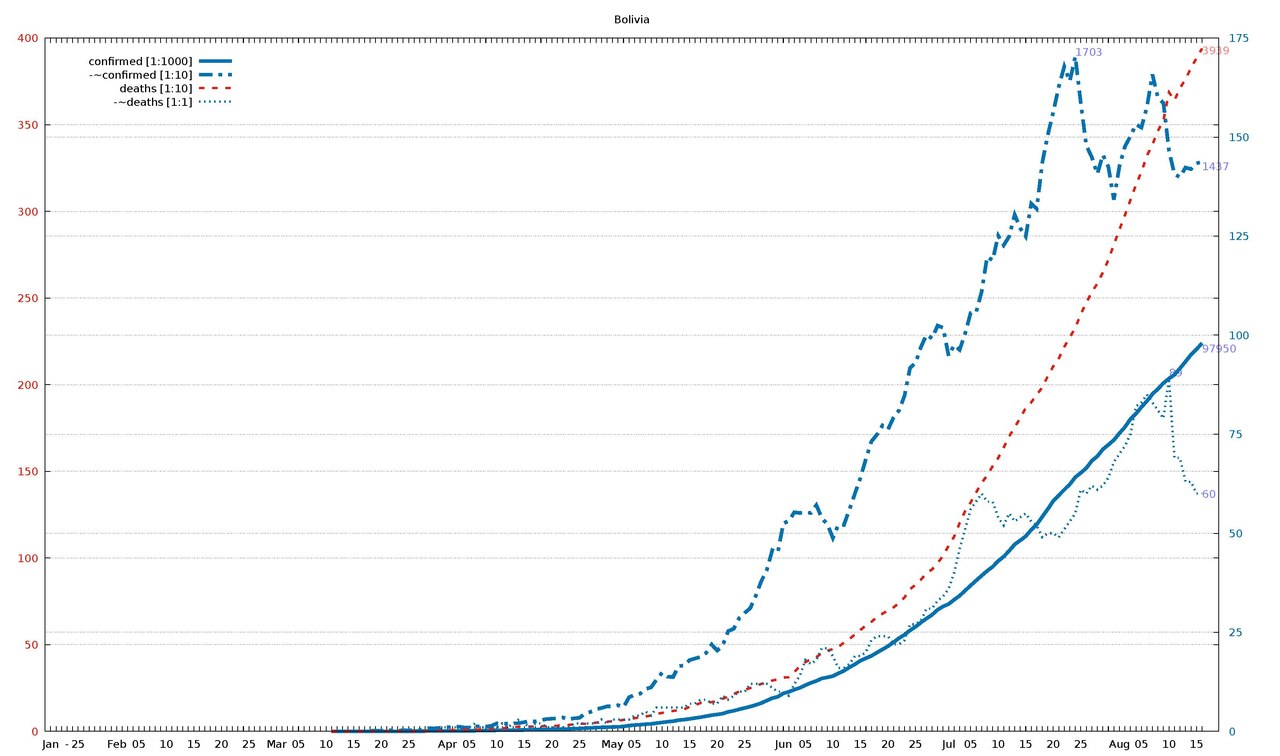
English: Diagram of WHO COVID-19 daily data (20 Jan - 16 Aug 2020) for "Total Confirmed Cases" (thick solid line), its smoothed increment (thick dash-dotted line), "Total Deaths" (thin dashed line) , and its smoothed increment (thin dotted line). Figures are taken from the available situation reports. Red and blue lines refer to the left and right vertical axis, respectively; the scaling factor for each curve is given in the legend. The horizontal axis starts on 20 Jan 2020 (situation report 1), and ends on 16 Aug 2020 (situation report 209). In the smoothed curves, for each day, 1/7 of the difference of the current day's figure and the figure a week ago is shown. For example, in situation report 115 (14 May 2020) and 121 (21 May 2020), there were 8676 and 5339 Total Confirmed Cases in Afghanistan, respectively, so the thick dash-dotted line passes through 477 = (8676-5339)/7 on 21 May.
For an overview of all related visualizations, and a more detailled description, see WHO Covid diagram set#Available country diagrams Jan-Aug 2020 (daily). |
| Date | |
| Source | Own work |
| Author | Jochen Burghardt |
Licensing[edit]
I, the copyright holder of this work, hereby publish it under the following license:
This file is licensed under the Creative Commons Attribution-Share Alike 4.0 International license.
- You are free:
- to share – to copy, distribute and transmit the work
- to remix – to adapt the work
- Under the following conditions:
- attribution – You must give appropriate credit, provide a link to the license, and indicate if changes were made. You may do so in any reasonable manner, but not in any way that suggests the licensor endorses you or your use.
- share alike – If you remix, transform, or build upon the material, you must distribute your contributions under the same or compatible license as the original.
Gnuplot source code[edit]
| Gnuplot source code |
|---|
set term pdf size 22,13
set term pdf font "sans,20"
set output "WHO_Covid_C_Bolivia.pdf"
set key autotitle columnhead
set termoption noenhanced
# (1) norm: 980 171 394 001
# (2) dist: 1,0:174 2,0:249 2,1:231
# (3,4) dist max: 249 2:394--0:980
# (4) right: 1 1 0 1
# (6,7) scMax: 400 175
# (8) scale: [1:1000] [1:10] [1:10] [1:1]


set xrange [-1:212]
set yrange [0:400]
set y2range [0:175]
set xtics 3650,100
set ytics 50 textcolor "#e51e10"
set y2tics 25 textcolor "#0072b2"
set grid y y2

set title "Bolivia"

$data <<EOF
rep day "confirmed [1:1000]" "-~confirmed [1:10]" "deaths [1:10]" "-~deaths [1:1]"
1	Jan	.	-	.	-
2	""	.	-	.	-
3	""	.	-	.	-
-	-	-	-	-	-
4	""	.	-	.	-
5	25	.	-	.	-
6	""	.	-	.	-
7	""	.	-	.	-
8	""	.	-	.	-
9	""	.	-	.	-
10	""	.	-	.	-
11	""	.	-	.	-
12	Feb	.	-	.	-
13	""	.	-	.	-
14	""	.	-	.	-
15	""	.	-	.	-
16	05	.	-	.	-
17	""	.	-	.	-
18	""	.	-	.	-
19	""	.	-	.	-
20	""	.	-	.	-
21	10	.	-	.	-
22	""	.	-	.	-
23	""	.	-	.	-
24	""	.	-	.	-
25	""	.	-	.	-
26	15	.	-	.	-
27	""	.	-	.	-
28	""	.	-	.	-
29	""	.	-	.	-
30	""	.	-	.	-
31	20	.	-	.	-
32	""	.	-	.	-
33	""	.	-	.	-
34	""	.	-	.	-
35	""	.	-	.	-
36	25	.	-	.	-
37	""	.	-	.	-
38	""	.	-	.	-
39	""	.	-	.	-
40	""	.	-	.	-
41	Mar	.	-	.	-
42	""	.	-	.	-
43	""	.	-	.	-
44	""	.	-	.	-
45	05	.	-	.	-
46	""	.	-	.	-
47	""	.	-	.	-
48	""	.	-	.	-
49	""	.	-	.	-
50	10	.	-	.	-
51	""	2	-	0	-
52	""	2	-	0	-
53	""	3	-	0	-
54	""	3	-	0	-
55	15	3	-	0	-
56	""	11	-	0	-
57	""	11	-	0	-
58	""	11	1	0	0
59	""	12	2	0	0
60	20	15	1	0	0
61	""	16	2	0	0
62	""	19	3	0	0
63	""	24	1	0	0
64	""	27	3	0	0
65	25	28	2	0	0
66	""	39	4	0	0
67	""	39	3	0	0
68	""	61	7	0	0
69	""	74	8	0	0
70	""	74	7	0	0
71	""	97	10	5	1
72	Apr	107	11	6	1
73	""	115	11	7	1
74	""	123	12	8	1
75	""	132	10	9	1
76	05	139	9	10	1
77	""	157	12	10	2
78	""	183	13	11	1
79	""	194	12	14	1
80	""	210	14	15	1
81	10	264	20	18	1
82	""	268	19	19	2
83	""	275	20	20	1
84	""	300	20	24	2
85	""	330	21	27	3
86	15	354	23	28	2
87	""	397	27	28	1
88	""	441	25	29	2
89	""	465	28	31	2
90	""	493	31	31	1
91	20	520	32	32	1
92	""	564	33	33	1
93	""	598	35	34	1
94	""	609	30	37	1
95	""	672	33	40	2
96	25	703	34	43	2
97	""	807	45	44	2
98	""	866	49	46	2
99	""	950	56	50	2
100	""	1014	59	53	3
101	""	1053	63	55	2
102	May	1110	63	59	3
103	""	1167	66	62	3
104	""	1229	61	66	3
105	""	1470	86	71	3
106	05	1594	92	76	4
107	""	1681	95	82	4
108	""	1802	107	86	5
109	""	1886	111	91	4
110	""	2081	131	102	6
111	10	2266	148	106	6
112	""	2437	138	114	6
113	""	2556	137	118	6
114	""	2831	165	122	6
115	""	2964	166	128	6
116	15	3148	180	142	7
117	""	3372	184	152	7
118	""	3577	188	164	8
119	""	3826	198	165	8
120	""	4088	219	169	7
121	20	4263	204	174	7
122	""	4481	217	189	9
123	""	4919	253	199	8
124	""	5187	259	215	9
125	""	5579	286	230	10
126	25	5915	299	240	10
127	""	6263	311	250	12
128	""	6660	342	261	12
129	""	7136	379	274	12
130	""	7768	407	280	12
131	""	8387	457	293	11
132	""	8731	451	300	10
133	Jun	9592	525	310	10
134	""	9982	531	313	9
135	""	10531	553	343	12
136	""	10991	551	376	14
137	05	11638	553	400	18
138	""	12245	551	415	17
139	""	12728	571	427	18
140	""	13358	538	454	21
141	""	13643	523	465	21
142	10	13949	488	475	19
143	""	14644	522	487	16
144	""	15281	521	512	16
145	""	16165	560	533	17
146	""	16929	600	559	19
147	15	17842	640	585	19
148	""	18459	688	611	20
149	""	19073	732	632	23
150	""	19883	749	659	24
151	""	20685	772	679	24
152	20	21499	762	697	24
153	""	22476	792	715	22
154	""	23512	810	740	22
155	""	24388	847	773	23
156	""	25493	917	820	27
157	25	26389	930	846	27
158	""	27487	971	876	28
159	""	28503	1001	913	31
160	""	29423	992	934	31
161	""	30676	1024	970	33
162	""	31524	1019	1014	34
163	Jul	32125	948	1071	36
164	""	33219	975	1123	40
165	""	34227	963	1201	46
166	""	35528	1004	1271	51
167	05	36818	1056	1320	56
168	""	38071	1057	1378	58
169	""	39297	1110	1434	60
170	""	40509	1198	1476	58
171	""	41545	1189	1530	58
172	10	42984	1251	1577	54
173	""	44113	1227	1638	52
174	""	45565	1249	1702	55
175	""	47200	1304	1754	53
176	""	48187	1270	1807	54
177	15	49250	1249	1866	55
178	""	50867	1332	1898	53
179	""	52218	1319	1942	52
180	""	54156	1435	1984	49
181	""	56102	1505	2049	50
182	20	58138	1563	2106	50
183	""	59582	1627	2151	49
184	""	60991	1678	2218	51
185	""	62357	1641	2273	53
186	""	64135	1703	2328	55
187	25	65252	1585	2407	61
188	""	66456	1479	2473	60
189	""	68281	1449	2535	62
190	""	69429	1407	2583	61
191	""	71181	1455	2647	62
192	""	72327	1425	2720	64
193	""	73534	1342	2808	68
194	Aug	75234	1426	2894	70
195	""	76789	1476	2977	72
196	""	78793	1502	3064	75
197	""	80153	1532	3153	82
198	05	81846	1524	3228	83
199	""	83361	1576	3320	85
200	""	85141	1658	3385	83
201	""	86423	1599	3465	81
202	""	87891	1586	3524	79
203	10	89055	1466	3687	89
204	""	89999	1406	3640	69
205	""	91635	1399	3712	69
206	""	93328	1423	3761	63
207	""	95071	1419	3827	63
208	15	96459	1434	3884	60
209	""	97950	1437	3939	60
EOF

# confirmed:
set label "97950  " at first 209, 97*400/175   left back textcolor "#8080ff"
# -~confirmed:
set label "1437   " at first 209,143*400/175   left back textcolor "#8080ff"
set label "1703   " at first 186,170*400/175+4 left back textcolor "#8080ff"
# deaths:
set label "3939   " at first 209,393           left back textcolor "#ff8080"
# -~deaths:
set label "60     " at first 209, 60*400/175   left back textcolor "#8080ff"
set label "89     " at first 203, 89*400/175+4 left back textcolor "#8080ff"

set multiplot
  plot $data using 0:($3/   1000*400/175) with lines lc 6 lw 8 dt 1 title at 0.150, 0.920
replot $data using 0:($4/     10*400/175) with lines lc 6 lw 8 dt 4 title at 0.150, 0.902
replot $data using 0:($5/     10        ) with lines lc 7 lw 5 dt 2 title at 0.150, 0.884
replot $data using 0:($6/      1*400/175) with lines lc 6 lw 5 dt 3 title at 0.150, 0.866

# plot hor axis calendar
replot $data using 0:(0):xticlabel(2) with lines
|
File history
Click on a date/time to view the file as it appeared at that time.
| Date/Time | Thumbnail | Dimensions | User | Comment | |
|---|---|---|---|---|---|
| current | 18:52, 24 September 2020 |  | 3,300 × 1,950 (24 KB) | Jochen Burghardt (talk | contribs) | =={{int:filedesc}}== {{Information |description={{en|1=Diagram of WHO COVID-19 daily data (20 Jan - 16 Aug 2020) for ''"Total Confirmed Cases"'' (thick solid line), its smoothed increment (thick dash-dotted line), ''"Total Deaths"'' (thin dashed line), and its smoothed increment (thin dotted line); see File:WHO_Covid_2020_Jan-Aug_daily_C_Afghanistan.pdf for details.}} |date=2020-09-24 |source={{own}} |author=Jochen Burghardt |permission= |other_versions=[[:File:... |
You cannot overwrite this file.
File usage on Commons
There are no pages that use this file.