File:WHO Covid 2020 Jan-Aug daily C Bosnia Herzegovina.pdf
Jump to navigation
Jump to search

Size of this JPG preview of this PDF file: 800 × 473 pixels. Other resolutions: 320 × 189 pixels | 640 × 378 pixels | 1,024 × 605 pixels | 1,280 × 756 pixels | 3,300 × 1,950 pixels.
Original file (3,300 × 1,950 pixels, file size: 24 KB, MIME type: application/pdf)
Captions
Captions
Add a one-line explanation of what this file represents
Summary[edit]
| Description |
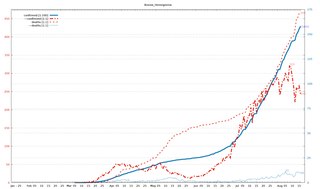
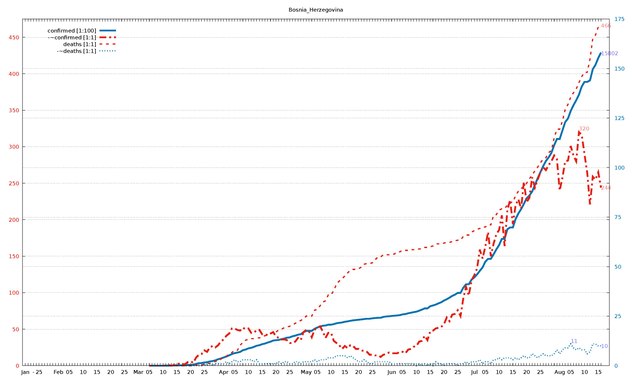
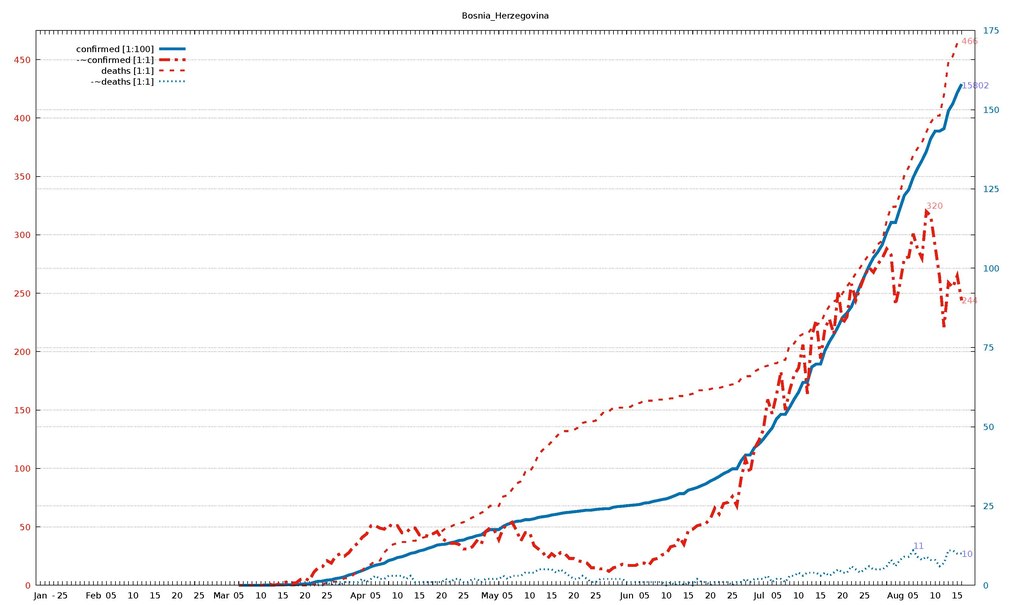
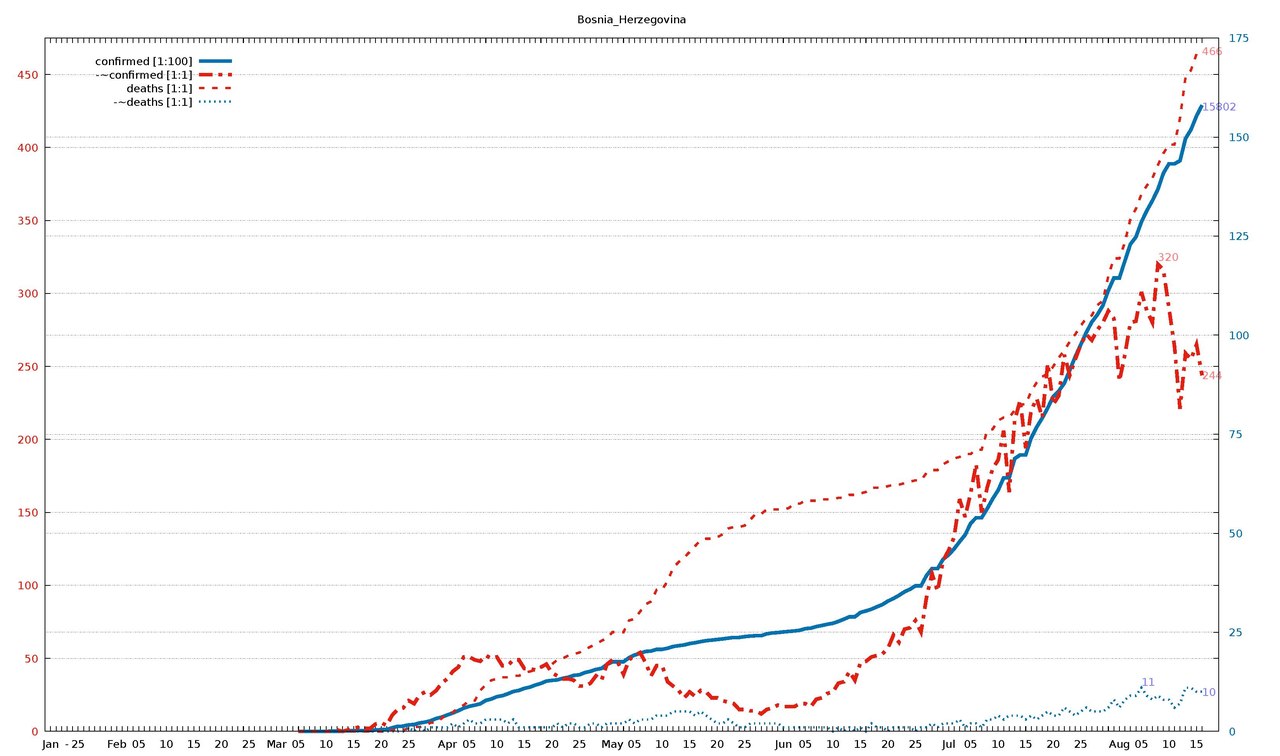
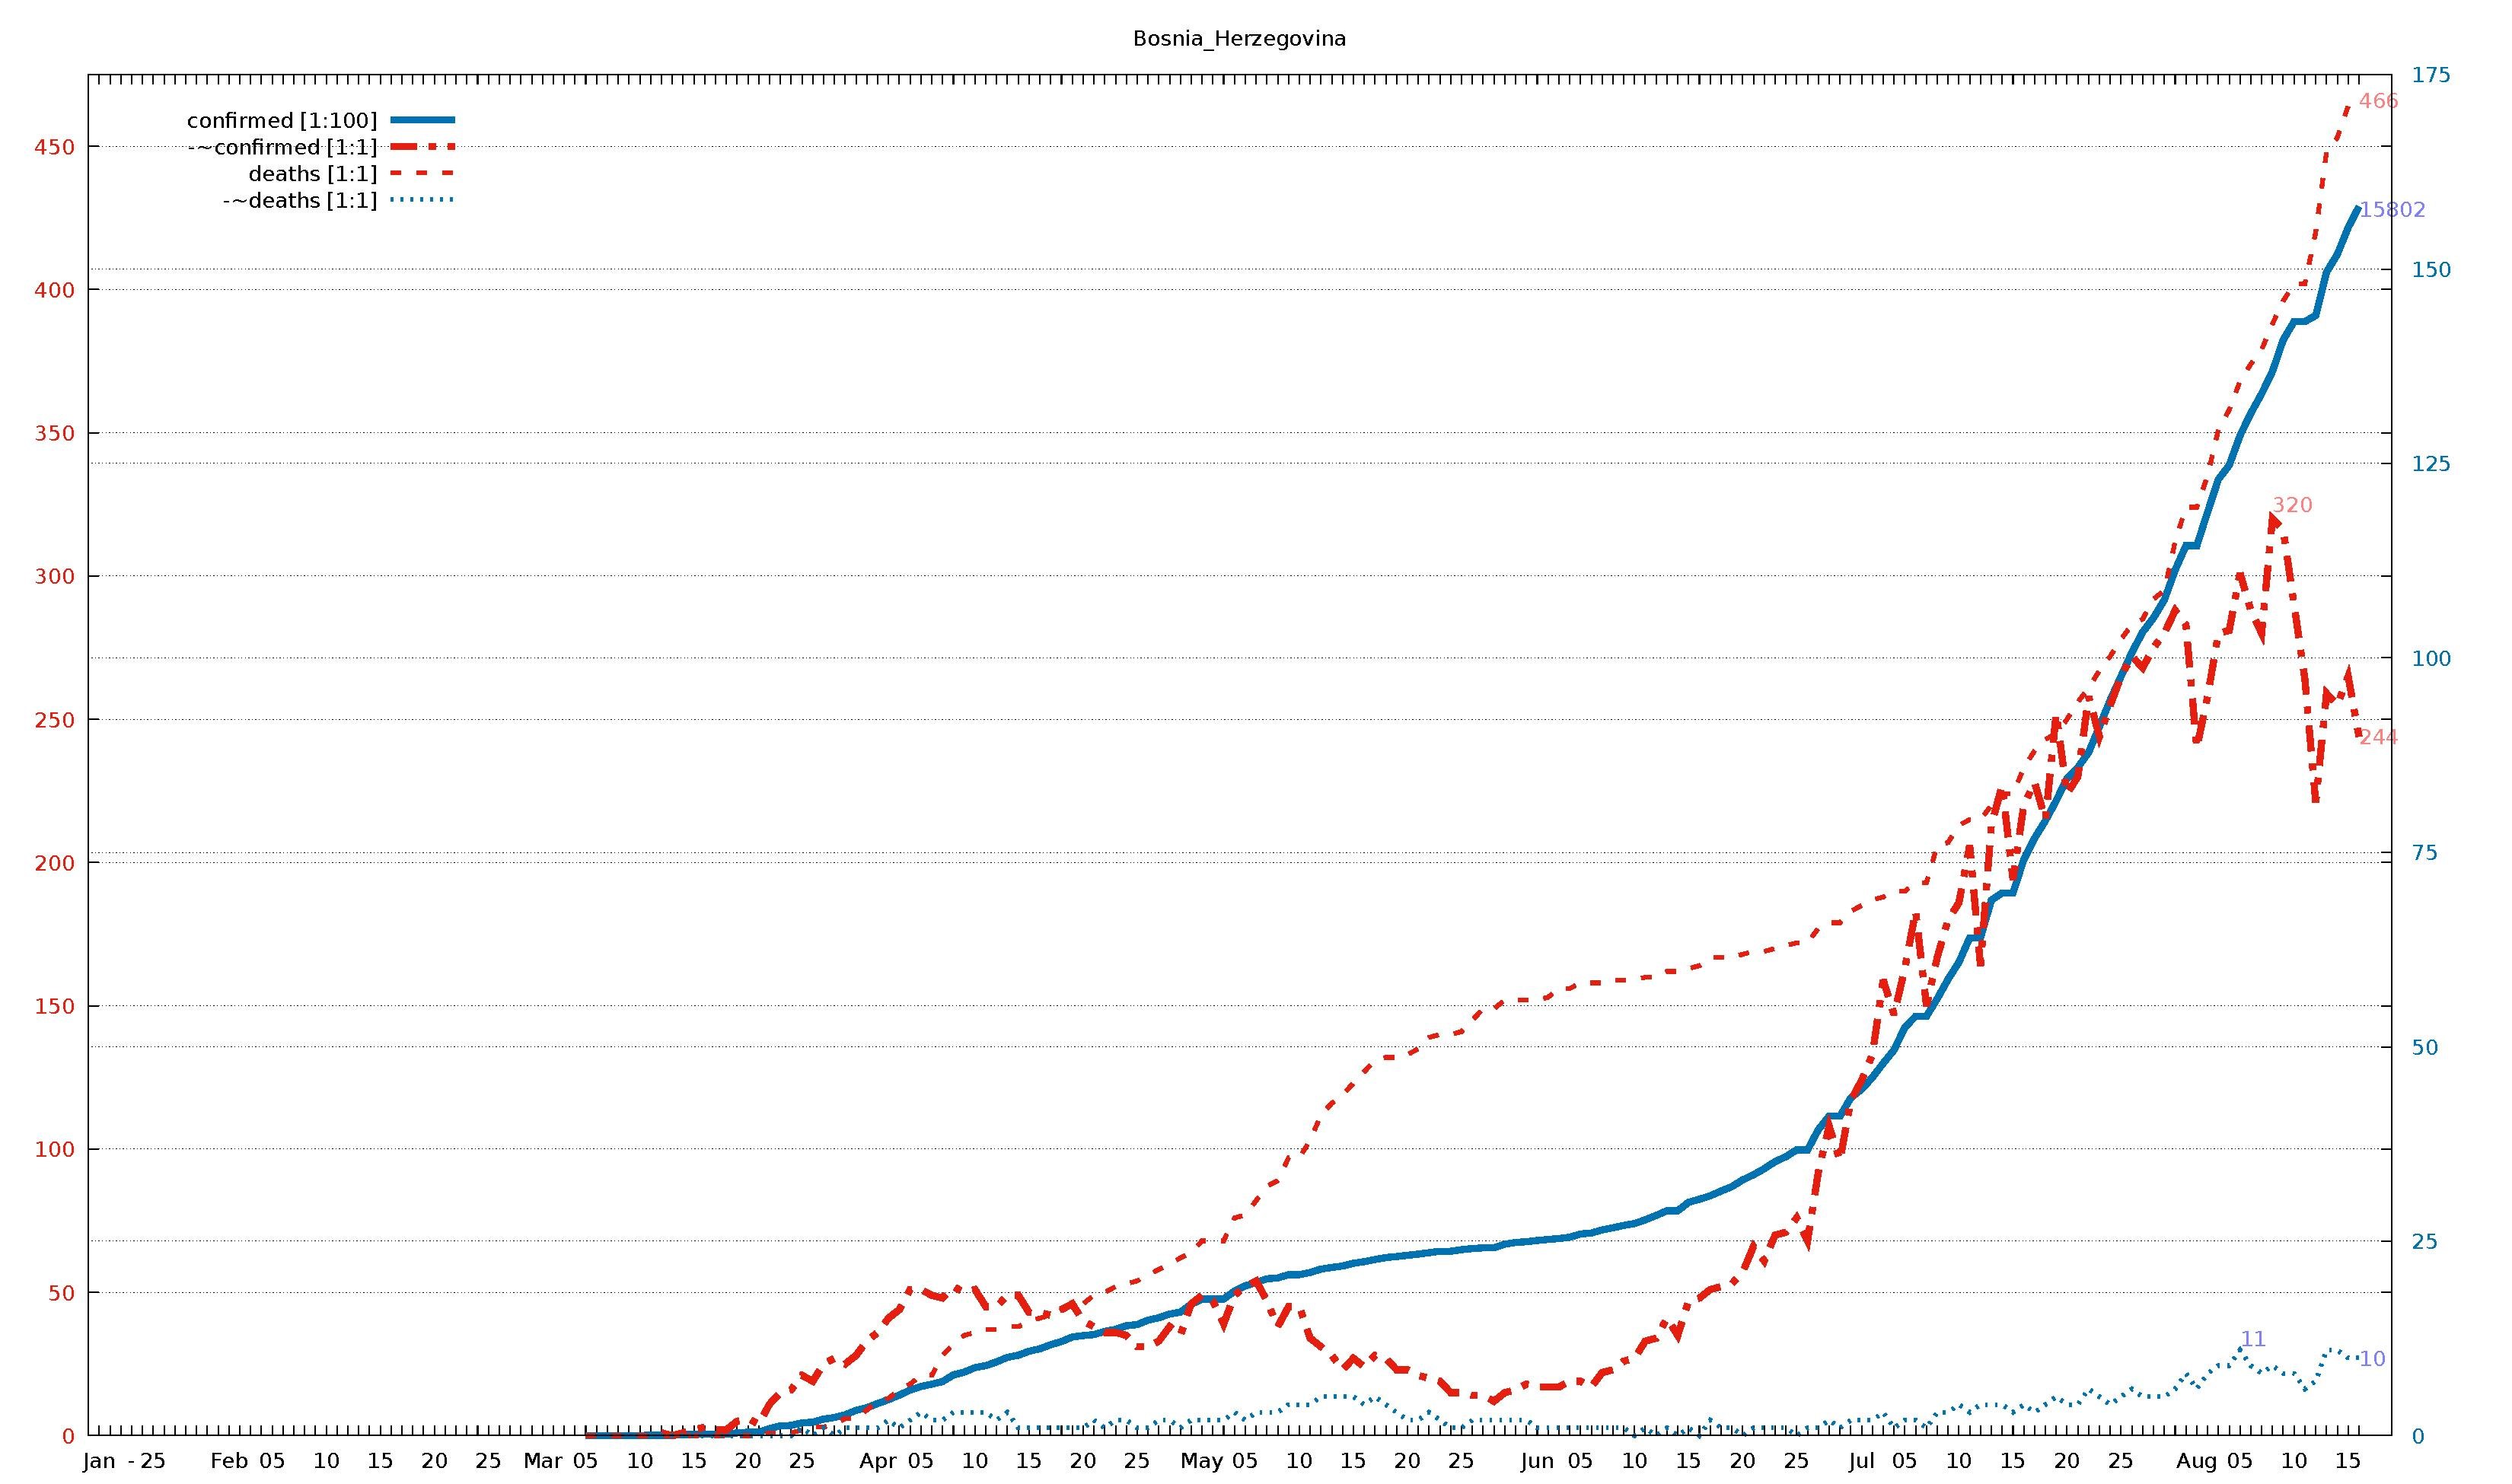
English: Diagram of WHO COVID-19 daily data (20 Jan - 16 Aug 2020) for "Total Confirmed Cases" (thick solid line), its smoothed increment (thick dash-dotted line), "Total Deaths" (thin dashed line) , and its smoothed increment (thin dotted line). Figures are taken from the available situation reports. Red and blue lines refer to the left and right vertical axis, respectively; the scaling factor for each curve is given in the legend. The horizontal axis starts on 20 Jan 2020 (situation report 1), and ends on 16 Aug 2020 (situation report 209). In the smoothed curves, for each day, 1/7 of the difference of the current day's figure and the figure a week ago is shown. For example, in situation report 115 (14 May 2020) and 121 (21 May 2020), there were 8676 and 5339 Total Confirmed Cases in Afghanistan, respectively, so the thick dash-dotted line passes through 477 = (8676-5339)/7 on 21 May.
For an overview of all related visualizations, and a more detailled description, see WHO Covid diagram set#Available country diagrams Jan-Aug 2020 (daily). |
| Date | |
| Source | Own work |
| Author | Jochen Burghardt |
Licensing[edit]
I, the copyright holder of this work, hereby publish it under the following license:
This file is licensed under the Creative Commons Attribution-Share Alike 4.0 International license.
- You are free:
- to share – to copy, distribute and transmit the work
- to remix – to adapt the work
- Under the following conditions:
- attribution – You must give appropriate credit, provide a link to the license, and indicate if changes were made. You may do so in any reasonable manner, but not in any way that suggests the licensor endorses you or your use.
- share alike – If you remix, transform, or build upon the material, you must distribute your contributions under the same or compatible license as the original.
Gnuplot source code[edit]
| Gnuplot source code |
|---|
set term pdf size 22,13
set term pdf font "sans,20"
set output "WHO_Covid_C_Bosnia_Herzegovina.pdf"
set key autotitle columnhead
set termoption noenhanced
# (1) norm: 159 320 466 001
# (2) dist: 1,0:202 2,0:293 2,1:146
# (3,4) dist max: 293 2:466--0:159
# (4) right: 1 0 0 1
# (6,7) scMax: 475 175
# (8) scale: [1:100] [1:1] [1:1] [1:1]


set xrange [-1:212]
set yrange [0:475]
set y2range [0:175]
set xtics 3650,100
set ytics 50 textcolor "#e51e10"
set y2tics 25 textcolor "#0072b2"
set grid y y2

set title "Bosnia_Herzegovina"

$data <<EOF
rep day "confirmed [1:100]" "-~confirmed [1:1]" "deaths [1:1]" "-~deaths [1:1]"
1	Jan	.	-	.	-
2	""	.	-	.	-
3	""	.	-	.	-
-	-	-	-	-	-
4	""	.	-	.	-
5	25	.	-	.	-
6	""	.	-	.	-
7	""	.	-	.	-
8	""	.	-	.	-
9	""	.	-	.	-
10	""	.	-	.	-
11	""	.	-	.	-
12	Feb	.	-	.	-
13	""	.	-	.	-
14	""	.	-	.	-
15	""	.	-	.	-
16	05	.	-	.	-
17	""	.	-	.	-
18	""	.	-	.	-
19	""	.	-	.	-
20	""	.	-	.	-
21	10	.	-	.	-
22	""	.	-	.	-
23	""	.	-	.	-
24	""	.	-	.	-
25	""	.	-	.	-
26	15	.	-	.	-
27	""	.	-	.	-
28	""	.	-	.	-
29	""	.	-	.	-
30	""	.	-	.	-
31	20	.	-	.	-
32	""	.	-	.	-
33	""	.	-	.	-
34	""	.	-	.	-
35	""	.	-	.	-
36	25	.	-	.	-
37	""	.	-	.	-
38	""	.	-	.	-
39	""	.	-	.	-
40	""	.	-	.	-
41	Mar	.	-	.	-
42	""	.	-	.	-
43	""	.	-	.	-
44	""	.	-	.	-
45	05	2	-	0	-
46	""	2	-	0	-
47	""	2	-	0	-
48	""	2	-	0	-
49	""	2	-	0	-
50	10	2	-	0	-
51	""	4	-	0	-
52	""	4	1	0	0
53	""	4	0	0	0
54	""	11	1	0	0
55	15	18	2	0	0
56	""	18	3	0	0
57	""	19	2	0	0
58	""	19	2	0	0
59	""	36	5	0	0
60	20	44	6	0	0
61	""	44	4	0	0
62	""	92	11	1	0
63	""	125	15	1	0
64	""	131	16	1	0
65	25	164	21	2	1
66	""	173	19	3	0
67	""	213	25	3	1
68	""	233	27	4	0
69	""	269	25	6	1
70	""	325	28	6	1
71	""	359	33	9	1
72	Apr	413	36	12	1
73	""	464	41	13	2
74	""	521	44	16	1
75	""	586	51	18	2
76	05	632	51	21	3
77	""	662	49	21	2
78	""	695	48	28	2
79	""	781	52	32	3
80	""	816	50	35	3
81	10	875	51	36	3
82	""	901	45	37	3
83	""	948	45	37	2
84	""	1007	49	38	3
85	""	1034	49	38	1
86	15	1086	43	40	1
87	""	1116	43	41	1
88	""	1169	42	42	1
89	""	1210	44	44	1
90	""	1268	46	46	1
91	20	1286	40	46	1
92	""	1300	38	49	2
93	""	1340	36	50	1
94	""	1367	36	52	2
95	""	1413	35	53	2
96	25	1428	31	54	1
97	""	1485	31	56	1
98	""	1516	33	58	2
99	""	1564	38	60	2
100	""	1588	35	62	1
101	""	1689	46	64	2
102	May	1757	49	68	2
103	""	1757	47	68	2
104	""	1757	39	68	2
105	""	1857	49	76	3
106	05	1926	52	77	2
107	""	1968	54	82	3
108	""	2017	47	87	3
109	""	2027	38	89	3
110	""	2070	45	97	4
111	10	2070	45	97	4
112	""	2098	34	103	4
113	""	2142	31	112	5
114	""	2162	28	116	5
115	""	2181	23	119	5
116	15	2216	27	123	5
117	""	2237	24	127	4
118	""	2265	28	131	5
119	""	2289	27	132	4
120	""	2303	23	132	3
121	20	2319	23	133	2
122	""	2334	21	135	2
123	""	2352	20	139	3
124	""	2371	19	140	2
125	""	2371	15	140	1
126	25	2391	15	141	1
127	""	2405	14	145	2
128	""	2415	14	149	2
129	""	2415	12	149	2
130	""	2462	15	152	2
131	""	2484	16	152	2
132	""	2493	18	152	2
133	Jun	2509	17	152	1
134	""	2523	17	153	1
135	""	2534	17	156	1
136	""	2550	19	156	1
137	05	2593	19	158	1
138	""	2605	17	158	1
139	""	2645	22	158	1
140	""	2673	23	159	1
141	""	2703	26	159	1
142	10	2727	27	159	0
143	""	2776	33	160	1
144	""	2831	34	160	0
145	""	2892	41	162	1
146	""	2892	35	162	0
147	15	3001	47	163	1
148	""	3039	48	164	0
149	""	3084	51	167	2
150	""	3144	52	167	1
151	""	3202	53	167	1
152	20	3288	57	168	0
153	""	3354	66	169	1
154	""	3431	61	169	1
155	""	3524	70	170	1
156	""	3587	71	171	1
157	25	3675	76	172	0
158	""	3675	68	172	1
159	""	3934	92	177	1
160	""	4107	108	179	2
161	""	4107	96	179	1
162	""	4343	117	183	2
163	Jul	4453	124	185	2
164	""	4606	133	187	2
165	""	4788	159	188	3
166	""	4960	147	190	1
167	05	5249	163	190	2
168	""	5393	183	193	2
169	""	5393	150	193	1
170	""	5618	167	206	3
171	""	5868	180	207	3
172	10	6087	186	213	4
173	""	6402	206	215	3
174	""	6402	164	215	4
175	""	6884	213	220	4
176	""	6979	227	224	4
177	15	6979	194	224	3
178	""	7407	220	233	4
179	""	7681	228	239	3
180	""	7908	215	243	4
181	""	8164	252	245	5
182	20	8452	224	250	4
183	""	8591	230	256	4
184	""	8786	258	261	6
185	""	9116	244	267	5
186	""	9460	255	272	4
187	25	9764	265	278	5
188	""	10069	272	283	6
189	""	10332	268	285	5
190	""	10515	275	292	5
191	""	10747	280	295	5
192	""	11129	288	312	6
193	""	11442	283	324	8
194	Aug	11442	240	324	6
195	""	11875	258	335	8
196	""	12296	280	351	9
197	""	12477	281	358	9
198	05	12858	301	368	11
199	""	13146	288	374	9
200	""	13397	280	379	8
201	""	13684	320	388	9
202	""	14089	316	396	8
203	10	14325	290	402	8
204	""	14325	264	402	6
205	""	14401	221	420	7
206	""	14960	259	448	11
207	""	15187	255	453	11
208	15	15534	265	464	10
209	""	15802	244	466	10
EOF

# confirmed:
set label "15802  " at first 209,158*475/175   left back textcolor "#8080ff"
# -~confirmed:
set label "244    " at first 209,244           left back textcolor "#ff8080"
set label "320    " at first 201,320        +5 left back textcolor "#ff8080"
# deaths:
set label "466    " at first 209,466           left back textcolor "#ff8080"
# -~deaths:
set label "10     " at first 209, 10*475/175   left back textcolor "#8080ff"
set label "11     " at first 198, 11*475/175+5 left back textcolor "#8080ff"

set multiplot
  plot $data using 0:($3/    100*475/175) with lines lc 6 lw 8 dt 1 title at 0.150, 0.920
replot $data using 0:($4/      1        ) with lines lc 7 lw 8 dt 4 title at 0.150, 0.902
replot $data using 0:($5/      1        ) with lines lc 7 lw 5 dt 2 title at 0.150, 0.884
replot $data using 0:($6/      1*475/175) with lines lc 6 lw 5 dt 3 title at 0.150, 0.866

# plot hor axis calendar
replot $data using 0:(0):xticlabel(2) with lines
|
File history
Click on a date/time to view the file as it appeared at that time.
| Date/Time | Thumbnail | Dimensions | User | Comment | |
|---|---|---|---|---|---|
| current | 18:52, 24 September 2020 |  | 3,300 × 1,950 (24 KB) | Jochen Burghardt (talk | contribs) | =={{int:filedesc}}== {{Information |description={{en|1=Diagram of WHO COVID-19 daily data (20 Jan - 16 Aug 2020) for ''"Total Confirmed Cases"'' (thick solid line), its smoothed increment (thick dash-dotted line), ''"Total Deaths"'' (thin dashed line), and its smoothed increment (thin dotted line); see File:WHO_Covid_2020_Jan-Aug_daily_C_Afghanistan.pdf for details.}} |date=2020-09-24 |source={{own}} |author=Jochen Burghardt |permission= |other_versions=[[:File:... |
You cannot overwrite this file.
File usage on Commons
There are no pages that use this file.