File:WHO Covid 2020 Jan-Aug daily C Cabo Verde.pdf
Jump to navigation
Jump to search

Size of this JPG preview of this PDF file: 800 × 473 pixels. Other resolutions: 320 × 189 pixels | 640 × 378 pixels | 1,024 × 605 pixels | 1,280 × 756 pixels | 3,300 × 1,950 pixels.
Original file (3,300 × 1,950 pixels, file size: 21 KB, MIME type: application/pdf)
Captions
Captions
Add a one-line explanation of what this file represents
Summary[edit]
| Description |
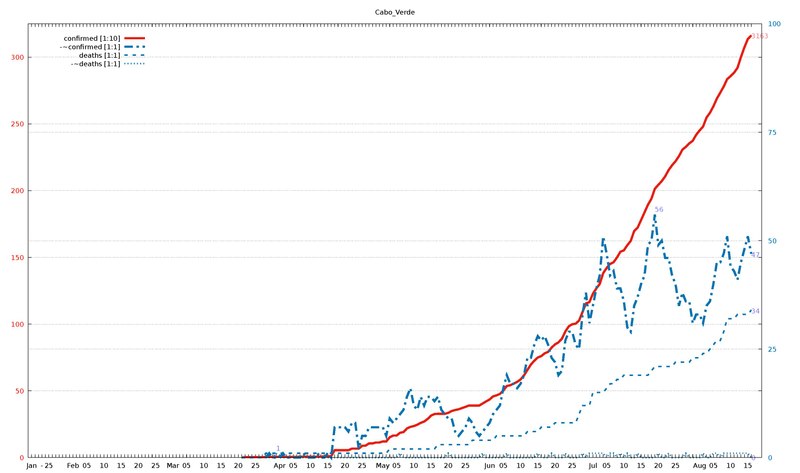
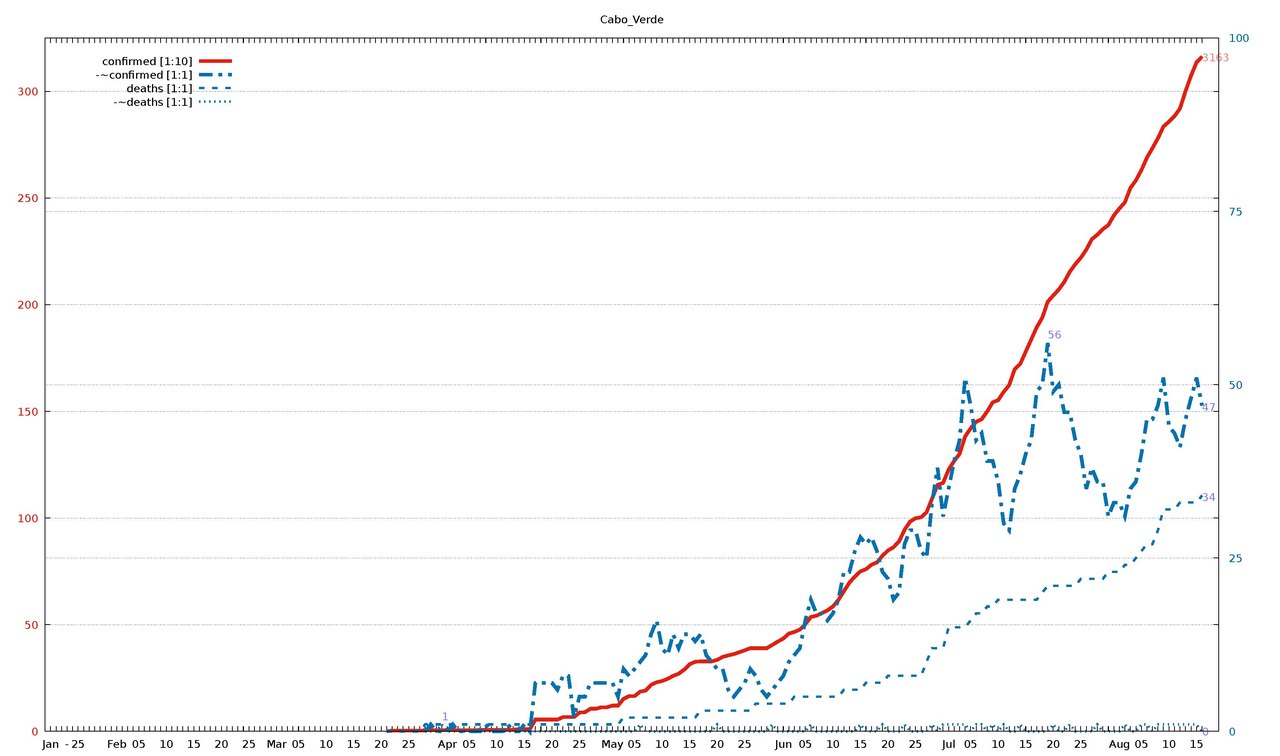
English: Diagram of WHO COVID-19 daily data (20 Jan - 16 Aug 2020) for "Total Confirmed Cases" (thick solid line), its smoothed increment (thick dash-dotted line), "Total Deaths" (thin dashed line) , and its smoothed increment (thin dotted line). Figures are taken from the available situation reports. Red and blue lines refer to the left and right vertical axis, respectively; the scaling factor for each curve is given in the legend. The horizontal axis starts on 20 Jan 2020 (situation report 1), and ends on 16 Aug 2020 (situation report 209). In the smoothed curves, for each day, 1/7 of the difference of the current day's figure and the figure a week ago is shown. For example, in situation report 115 (14 May 2020) and 121 (21 May 2020), there were 8676 and 5339 Total Confirmed Cases in Afghanistan, respectively, so the thick dash-dotted line passes through 477 = (8676-5339)/7 on 21 May.
For an overview of all related visualizations, and a more detailled description, see WHO Covid diagram set#Available country diagrams Jan-Aug 2020 (daily). |
| Date | |
| Source | Own work |
| Author | Jochen Burghardt |
Licensing[edit]
I, the copyright holder of this work, hereby publish it under the following license:
This file is licensed under the Creative Commons Attribution-Share Alike 4.0 International license.
- You are free:
- to share – to copy, distribute and transmit the work
- to remix – to adapt the work
- Under the following conditions:
- attribution – You must give appropriate credit, provide a link to the license, and indicate if changes were made. You may do so in any reasonable manner, but not in any way that suggests the licensor endorses you or your use.
- share alike – If you remix, transform, or build upon the material, you must distribute your contributions under the same or compatible license as the original.
Gnuplot source code[edit]
| Gnuplot source code |
|---|
set term pdf size 22,13
set term pdf font "sans,20"
set output "WHO_Covid_C_Cabo_Verde.pdf"
set key autotitle columnhead
set termoption noenhanced
# (1) norm: 317 001 001 001

set xrange [-1:212]
set yrange [0:325]
set y2range [0:100]
set xtics 3650,100
set ytics 50 textcolor "#e51e10"
set y2tics 25 textcolor "#0072b2"
set grid y y2

set title "Cabo_Verde"

$data <<EOF
rep day "confirmed [1:10]" "-~confirmed [1:1]" "deaths [1:1]" "-~deaths [1:1]"
1	Jan	.	-	.	-
2	""	.	-	.	-
3	""	.	-	.	-
-	-	-	-	-	-
4	""	.	-	.	-
5	25	.	-	.	-
6	""	.	-	.	-
7	""	.	-	.	-
8	""	.	-	.	-
9	""	.	-	.	-
10	""	.	-	.	-
11	""	.	-	.	-
12	Feb	.	-	.	-
13	""	.	-	.	-
14	""	.	-	.	-
15	""	.	-	.	-
16	05	.	-	.	-
17	""	.	-	.	-
18	""	.	-	.	-
19	""	.	-	.	-
20	""	.	-	.	-
21	10	.	-	.	-
22	""	.	-	.	-
23	""	.	-	.	-
24	""	.	-	.	-
25	""	.	-	.	-
26	15	.	-	.	-
27	""	.	-	.	-
28	""	.	-	.	-
29	""	.	-	.	-
30	""	.	-	.	-
31	20	.	-	.	-
32	""	.	-	.	-
33	""	.	-	.	-
34	""	.	-	.	-
35	""	.	-	.	-
36	25	.	-	.	-
37	""	.	-	.	-
38	""	.	-	.	-
39	""	.	-	.	-
40	""	.	-	.	-
41	Mar	.	-	.	-
42	""	.	-	.	-
43	""	.	-	.	-
44	""	.	-	.	-
45	05	.	-	.	-
46	""	.	-	.	-
47	""	.	-	.	-
48	""	.	-	.	-
49	""	.	-	.	-
50	10	.	-	.	-
51	""	.	-	.	-
52	""	.	-	.	-
53	""	.	-	.	-
54	""	.	-	.	-
55	15	.	-	.	-
56	""	.	-	.	-
57	""	.	-	.	-
58	""	.	-	.	-
59	""	.	-	.	-
60	20	.	-	.	-
61	""	1	-	0	-
62	""	3	-	0	-
63	""	3	-	0	-
64	""	3	-	0	-
65	25	3	-	0	-
66	""	3	-	0	-
67	""	3	-	0	-
68	""	5	0	1	0
69	""	5	1	1	0
70	""	5	0	1	0
71	""	5	0	1	1
72	Apr	5	0	1	0
73	""	5	1	1	0
74	""	5	0	1	0
75	""	5	0	1	0
76	05	5	0	1	0
77	""	5	0	1	0
78	""	7	0	1	0
79	""	7	1	1	0
80	""	7	0	1	0
81	10	7	0	1	0
82	""	7	0	1	0
83	""	7	1	1	0
84	""	7	0	1	0
85	""	10	0	1	0
86	15	10	1	1	0
87	""	10	0	1	0
88	""	55	7	1	0
89	""	55	7	1	0
90	""	55	7	1	0
91	20	55	7	1	0
92	""	55	6	1	0
93	""	67	8	1	0
94	""	67	8	1	0
95	""	67	2	1	0
96	25	88	5	1	0
97	""	90	5	1	0
98	""	106	7	1	0
99	""	106	7	1	0
100	""	113	7	1	0
101	""	113	7	1	0
102	May	121	7	1	0
103	""	121	5	1	0
104	""	152	9	2	0
105	""	165	8	2	0
106	05	165	9	2	0
107	""	186	10	2	1
108	""	191	11	2	0
109	""	218	14	2	0
110	""	230	16	2	0
111	10	236	12	2	0
112	""	246	11	2	0
113	""	260	14	2	0
114	""	270	12	2	0
115	""	289	14	2	0
116	15	315	14	2	0
117	""	326	13	2	0
118	""	328	14	3	0
119	""	328	11	3	0
120	""	328	10	3	0
121	20	335	9	3	1
122	""	349	9	3	0
123	""	356	6	3	0
124	""	362	5	3	0
125	""	371	6	3	0
126	25	380	7	3	0
127	""	390	9	3	0
128	""	390	8	4	0
129	""	390	6	4	0
130	""	390	5	4	0
131	""	405	6	4	1
132	""	421	7	4	0
133	Jun	435	8	4	0
134	""	458	10	4	0
135	""	466	11	5	0
136	""	477	12	5	0
137	05	502	16	5	0
138	""	536	19	5	1
139	""	542	17	5	0
140	""	554	17	5	0
141	""	567	16	5	0
142	10	585	17	5	0
143	""	616	19	5	0
144	""	657	23	6	0
145	""	697	23	6	0
146	""	726	26	6	0
147	15	750	28	6	1
148	""	760	27	7	0
149	""	781	28	7	0
150	""	792	26	7	0
151	""	823	23	7	1
152	20	848	22	8	0
153	""	863	19	8	0
154	""	890	20	8	0
155	""	944	27	8	1
156	""	983	29	8	0
157	25	999	29	8	0
158	""	1003	26	8	0
159	""	1027	25	10	0
160	""	1091	33	12	1
161	""	1155	38	12	0
162	""	1165	31	12	1
163	Jul	1227	35	15	1
164	""	1267	39	15	1
165	""	1301	42	15	1
166	""	1382	51	15	1
167	05	1420	47	16	0
168	""	1451	42	17	1
169	""	1463	43	17	1
170	""	1499	39	18	0
171	""	1542	39	18	1
172	10	1553	36	19	0
173	""	1591	30	19	1
174	""	1623	29	19	0
175	""	1698	35	19	0
176	""	1722	37	19	1
177	15	1780	40	19	0
178	""	1837	42	19	0
179	""	1894	49	19	0
180	""	1939	50	20	0
181	""	2014	56	21	0
182	20	2043	49	21	1
183	""	2071	50	21	0
184	""	2107	46	21	0
185	""	2154	46	21	1
186	""	2190	42	21	0
187	25	2220	40	22	0
188	""	2258	35	22	0
189	""	2307	38	22	0
190	""	2328	36	22	1
191	""	2354	36	22	0
192	""	2373	31	23	0
193	""	2418	33	23	0
194	Aug	2451	33	23	0
195	""	2480	31	24	1
196	""	2547	35	24	0
197	""	2583	36	25	0
198	05	2631	40	26	1
199	""	2689	45	27	1
200	""	2734	45	27	0
201	""	2780	47	29	1
202	""	2835	51	32	1
203	10	2858	44	32	1
204	""	2883	43	32	1
205	""	2920	41	33	1
206	""	3000	45	33	1
207	""	3073	48	33	1
208	15	3136	51	33	1
209	""	3163	47	34	0
EOF

# confirmed:
set label "3163   " at first 209,316           left back textcolor "#ff8080"
# -~confirmed:
set label "47     " at first 209, 47*325/100   left back textcolor "#8080ff"
set label "56     " at first 181, 56*325/100+4 left back textcolor "#8080ff"
# deaths:
set label "34     " at first 209, 34*325/100   left back textcolor "#8080ff"
# -~deaths:
set label "0      " at first 209,  0*325/100   left back textcolor "#8080ff"
set label "1      " at first  71,  1*325/100+4 left back textcolor "#8080ff"

set multiplot
  plot $data using 0:($3/     10        ) with lines lc 7 lw 8 dt 1 title at 0.150, 0.920
replot $data using 0:($4/      1*325/100) with lines lc 6 lw 8 dt 4 title at 0.150, 0.902
replot $data using 0:($5/      1*325/100) with lines lc 6 lw 5 dt 2 title at 0.150, 0.884
replot $data using 0:($6/      1*325/100) with lines lc 6 lw 5 dt 3 title at 0.150, 0.866

# plot hor axis calendar
replot $data using 0:(0):xticlabel(2) with lines
|
File history
Click on a date/time to view the file as it appeared at that time.
| Date/Time | Thumbnail | Dimensions | User | Comment | |
|---|---|---|---|---|---|
| current | 18:54, 24 September 2020 |  | 3,300 × 1,950 (21 KB) | Jochen Burghardt (talk | contribs) | =={{int:filedesc}}== {{Information |description={{en|1=Diagram of WHO COVID-19 daily data (20 Jan - 16 Aug 2020) for ''"Total Confirmed Cases"'' (thick solid line), its smoothed increment (thick dash-dotted line), ''"Total Deaths"'' (thin dashed line), and its smoothed increment (thin dotted line); see File:WHO_Covid_2020_Jan-Aug_daily_C_Afghanistan.pdf for details.}} |date=2020-09-24 |source={{own}} |author=Jochen Burghardt |permission= |other_versions=[[:File:... |
You cannot overwrite this file.
File usage on Commons
There are no pages that use this file.