File:WHO Covid 2020 Jan-Aug daily C Cameroon.pdf
Jump to navigation
Jump to search

Size of this JPG preview of this PDF file: 800 × 473 pixels. Other resolutions: 320 × 189 pixels | 640 × 378 pixels | 1,024 × 605 pixels | 1,280 × 756 pixels | 3,300 × 1,950 pixels.
Original file (3,300 × 1,950 pixels, file size: 23 KB, MIME type: application/pdf)
Captions
Captions
Add a one-line explanation of what this file represents
Summary[edit]
| Description |
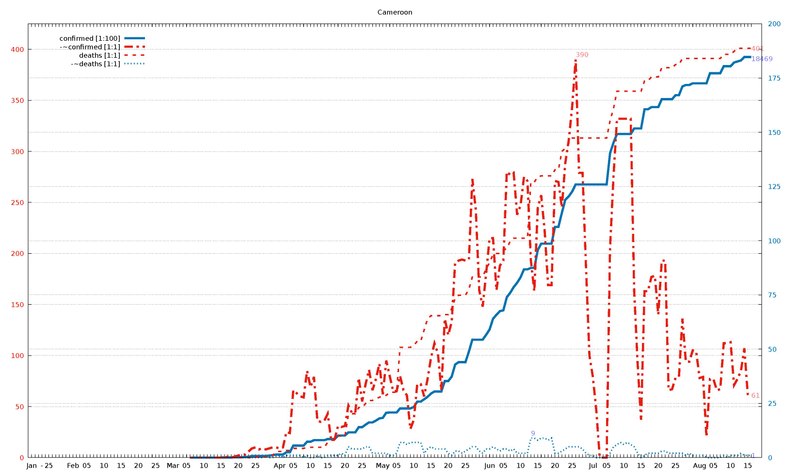
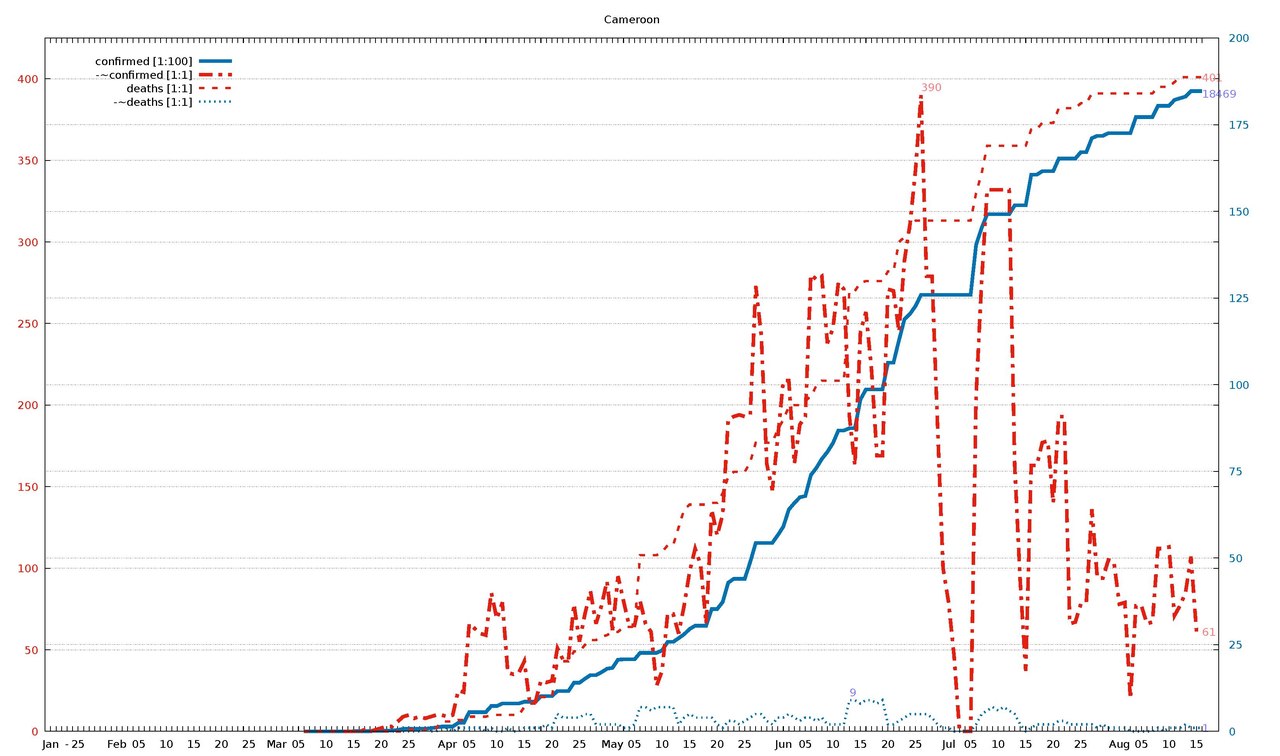
English: Diagram of WHO COVID-19 daily data (20 Jan - 16 Aug 2020) for "Total Confirmed Cases" (thick solid line), its smoothed increment (thick dash-dotted line), "Total Deaths" (thin dashed line) , and its smoothed increment (thin dotted line). Figures are taken from the available situation reports. Red and blue lines refer to the left and right vertical axis, respectively; the scaling factor for each curve is given in the legend. The horizontal axis starts on 20 Jan 2020 (situation report 1), and ends on 16 Aug 2020 (situation report 209). In the smoothed curves, for each day, 1/7 of the difference of the current day's figure and the figure a week ago is shown. For example, in situation report 115 (14 May 2020) and 121 (21 May 2020), there were 8676 and 5339 Total Confirmed Cases in Afghanistan, respectively, so the thick dash-dotted line passes through 477 = (8676-5339)/7 on 21 May.
For an overview of all related visualizations, and a more detailled description, see WHO Covid diagram set#Available country diagrams Jan-Aug 2020 (daily). |
| Date | |
| Source | Own work |
| Author | Jochen Burghardt |
Licensing[edit]
I, the copyright holder of this work, hereby publish it under the following license:
This file is licensed under the Creative Commons Attribution-Share Alike 4.0 International license.
- You are free:
- to share – to copy, distribute and transmit the work
- to remix – to adapt the work
- Under the following conditions:
- attribution – You must give appropriate credit, provide a link to the license, and indicate if changes were made. You may do so in any reasonable manner, but not in any way that suggests the licensor endorses you or your use.
- share alike – If you remix, transform, or build upon the material, you must distribute your contributions under the same or compatible license as the original.
Gnuplot source code[edit]
| Gnuplot source code |
|---|
set term pdf size 22,13
set term pdf font "sans,20"
set output "WHO_Covid_C_Cameroon.pdf"
set key autotitle columnhead
set termoption noenhanced
# (1) norm: 185 390 401 001
# (2) dist: 1,0:211 2,0:217 2,1:103
# (3,4) dist max: 217 2:401--0:185
# (4) right: 1 0 0 1
# (6,7) scMax: 425 200
# (8) scale: [1:100] [1:1] [1:1] [1:1]


set xrange [-1:212]
set yrange [0:425]
set y2range [0:200]
set xtics 3650,100
set ytics 50 textcolor "#e51e10"
set y2tics 25 textcolor "#0072b2"
set grid y y2

set title "Cameroon"

$data <<EOF
rep day "confirmed [1:100]" "-~confirmed [1:1]" "deaths [1:1]" "-~deaths [1:1]"
1	Jan	.	-	.	-
2	""	.	-	.	-
3	""	.	-	.	-
-	-	-	-	-	-
4	""	.	-	.	-
5	25	.	-	.	-
6	""	.	-	.	-
7	""	.	-	.	-
8	""	.	-	.	-
9	""	.	-	.	-
10	""	.	-	.	-
11	""	.	-	.	-
12	Feb	.	-	.	-
13	""	.	-	.	-
14	""	.	-	.	-
15	""	.	-	.	-
16	05	.	-	.	-
17	""	.	-	.	-
18	""	.	-	.	-
19	""	.	-	.	-
20	""	.	-	.	-
21	10	.	-	.	-
22	""	.	-	.	-
23	""	.	-	.	-
24	""	.	-	.	-
25	""	.	-	.	-
26	15	.	-	.	-
27	""	.	-	.	-
28	""	.	-	.	-
29	""	.	-	.	-
30	""	.	-	.	-
31	20	.	-	.	-
32	""	.	-	.	-
33	""	.	-	.	-
34	""	.	-	.	-
35	""	.	-	.	-
36	25	.	-	.	-
37	""	.	-	.	-
38	""	.	-	.	-
39	""	.	-	.	-
40	""	.	-	.	-
41	Mar	.	-	.	-
42	""	.	-	.	-
43	""	.	-	.	-
44	""	.	-	.	-
45	05	.	-	.	-
46	""	1	-	0	-
47	""	2	-	0	-
48	""	2	-	0	-
49	""	2	-	0	-
50	10	2	-	0	-
51	""	2	-	0	-
52	""	2	-	0	-
53	""	2	0	0	0
54	""	2	0	0	0
55	15	3	0	0	0
56	""	3	0	0	0
57	""	5	1	0	0
58	""	5	0	0	0
59	""	10	1	0	0
60	20	15	2	0	0
61	""	22	3	0	0
62	""	27	3	0	0
63	""	40	6	0	0
64	""	72	9	0	0
65	25	72	10	1	0
66	""	70	8	1	0
67	""	75	9	1	0
68	""	75	8	1	1
69	""	91	9	2	0
70	""	113	10	2	0
71	""	139	10	6	1
72	Apr	139	9	6	1
73	""	139	10	6	0
74	""	246	25	7	1
75	""	246	24	7	1
76	05	555	66	9	1
77	""	555	63	9	1
78	""	555	60	9	1
79	""	555	59	9	0
80	""	730	85	10	1
81	10	730	69	10	0
82	""	803	79	10	0
83	""	803	36	10	1
84	""	803	35	10	0
85	""	803	36	10	0
86	15	855	43	15	1
87	""	855	17	17	1
88	""	855	18	17	1
89	""	1016	31	21	1
90	""	1016	30	21	2
91	20	1016	31	21	1
92	""	1163	51	42	5
93	""	1163	44	43	4
94	""	1163	44	43	4
95	""	1401	78	49	4
96	25	1403	55	49	4
97	""	1518	72	53	5
98	""	1621	86	56	5
99	""	1621	66	56	2
100	""	1705	77	58	2
101	""	1806	92	59	2
102	May	1832	62	61	2
103	""	2069	95	61	2
104	""	2077	80	64	1
105	""	2077	65	64	1
106	05	2077	65	64	2
107	""	2265	80	108	7
108	""	2265	66	108	7
109	""	2265	61	108	6
110	""	2265	28	108	7
111	10	2335	37	110	7
112	""	2579	72	114	7
113	""	2579	72	114	7
114	""	2689	60	125	2
115	""	2800	77	136	4
116	15	2954	98	139	5
117	""	3047	112	139	4
118	""	3047	102	139	4
119	""	3047	66	139	4
120	""	3529	136	140	4
121	20	3529	120	140	2
122	""	3733	133	146	1
123	""	4288	191	156	3
124	""	4400	193	159	3
125	""	4400	194	159	2
126	25	4400	193	159	3
127	""	4890	194	165	4
128	""	5436	273	177	5
129	""	5436	243	177	5
130	""	5436	164	177	3
131	""	5436	148	177	2
132	""	5659	180	185	4
133	Jun	5904	215	191	4
134	""	6397	215	199	5
135	""	6585	164	200	4
136	""	6752	188	200	3
137	05	6789	193	203	4
138	""	7392	280	205	4
139	""	7599	277	212	3
140	""	7860	279	215	4
141	""	8060	238	215	2
142	10	8312	247	215	2
143	""	8681	275	215	2
144	""	8681	271	215	2
145	""	8743	193	270	9
146	""	8743	163	270	9
147	15	9572	245	275	8
148	""	9864	257	276	9
149	""	9864	222	276	9
150	""	9864	169	276	8
151	""	9864	169	276	9
152	20	10638	271	282	2
153	""	10638	270	282	2
154	""	11281	245	300	3
155	""	11892	289	303	4
156	""	12041	311	308	5
157	25	12270	344	313	5
158	""	12592	390	313	5
159	""	12592	279	313	5
160	""	12592	279	313	4
161	""	12592	187	313	2
162	""	12592	100	313	1
163	Jul	12592	79	313	1
164	""	12592	46	313	0
165	""	12592	0	313	0
166	""	12592	0	313	0
167	05	12592	0	313	0
168	""	14037	206	330	2
169	""	14524	276	342	5
170	""	14916	332	359	6
171	""	14916	332	359	7
172	10	14916	332	359	6
173	""	14916	332	359	7
174	""	14916	332	359	6
175	""	15173	163	359	5
176	""	15173	92	359	2
177	15	15173	37	359	0
178	""	16057	163	369	1
179	""	16057	163	369	2
180	""	16157	177	373	2
181	""	16157	178	373	2
182	20	16157	140	373	2
183	""	16522	193	382	3
184	""	16522	193	382	3
185	""	16522	66	382	2
186	""	16522	67	382	2
187	25	16708	78	385	2
188	""	16708	79	385	2
189	""	17110	136	391	2
190	""	17179	94	391	1
191	""	17179	94	391	2
192	""	17255	105	391	1
193	""	17255	104	391	1
194	Aug	17255	78	391	1
195	""	17255	79	391	1
196	""	17255	20	391	0
197	""	17718	77	391	0
198	05	17718	77	391	0
199	""	17718	66	391	0
200	""	17718	67	391	0
201	""	18042	112	395	1
202	""	18042	112	395	0
203	10	18042	113	395	1
204	""	18213	71	398	1
205	""	18263	77	401	1
206	""	18308	85	401	2
207	""	18469	107	401	1
208	15	18469	61	401	1
209	""	18469	61	401	1
EOF

# confirmed:
set label "18469  " at first 209,184*425/200   left back textcolor "#8080ff"
# -~confirmed:
set label "61     " at first 209, 61           left back textcolor "#ff8080"
set label "390    " at first 158,390        +5 left back textcolor "#ff8080"
# deaths:
set label "401    " at first 209,401           left back textcolor "#ff8080"
# -~deaths:
set label "1      " at first 209,  1*425/200   left back textcolor "#8080ff"
set label "9      " at first 145,  9*425/200+5 left back textcolor "#8080ff"

set multiplot
  plot $data using 0:($3/    100*425/200) with lines lc 6 lw 8 dt 1 title at 0.150, 0.920
replot $data using 0:($4/      1        ) with lines lc 7 lw 8 dt 4 title at 0.150, 0.902
replot $data using 0:($5/      1        ) with lines lc 7 lw 5 dt 2 title at 0.150, 0.884
replot $data using 0:($6/      1*425/200) with lines lc 6 lw 5 dt 3 title at 0.150, 0.866

# plot hor axis calendar
replot $data using 0:(0):xticlabel(2) with lines
|
File history
Click on a date/time to view the file as it appeared at that time.
| Date/Time | Thumbnail | Dimensions | User | Comment | |
|---|---|---|---|---|---|
| current | 18:55, 24 September 2020 |  | 3,300 × 1,950 (23 KB) | Jochen Burghardt (talk | contribs) | =={{int:filedesc}}== {{Information |description={{en|1=Diagram of WHO COVID-19 daily data (20 Jan - 16 Aug 2020) for ''"Total Confirmed Cases"'' (thick solid line), its smoothed increment (thick dash-dotted line), ''"Total Deaths"'' (thin dashed line), and its smoothed increment (thin dotted line); see File:WHO_Covid_2020_Jan-Aug_daily_C_Afghanistan.pdf for details.}} |date=2020-09-24 |source={{own}} |author=Jochen Burghardt |permission= |other_versions=[[:File:... |
You cannot overwrite this file.
File usage on Commons
There are no pages that use this file.