File:WHO Covid 2020 Jan-Aug daily C Canada.pdf
Jump to navigation
Jump to search

Size of this JPG preview of this PDF file: 800 × 473 pixels. Other resolutions: 320 × 189 pixels | 640 × 378 pixels | 1,024 × 605 pixels | 1,280 × 756 pixels | 3,300 × 1,950 pixels.
Original file (3,300 × 1,950 pixels, file size: 25 KB, MIME type: application/pdf)
Captions
Captions
Add a one-line explanation of what this file represents
Summary[edit]
| Description |
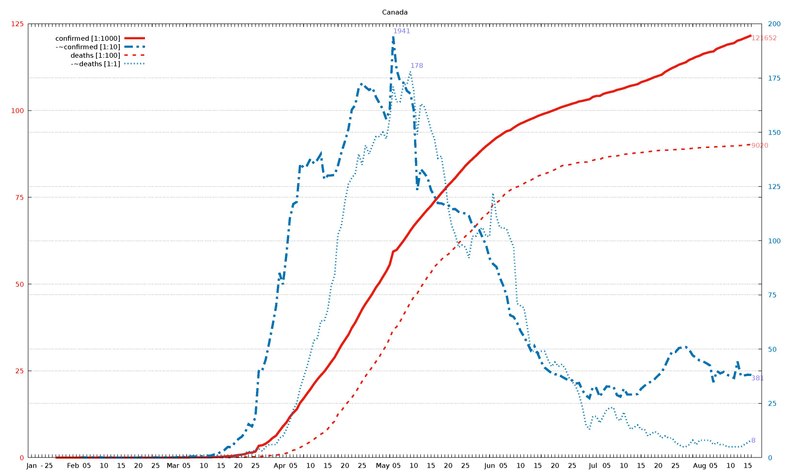
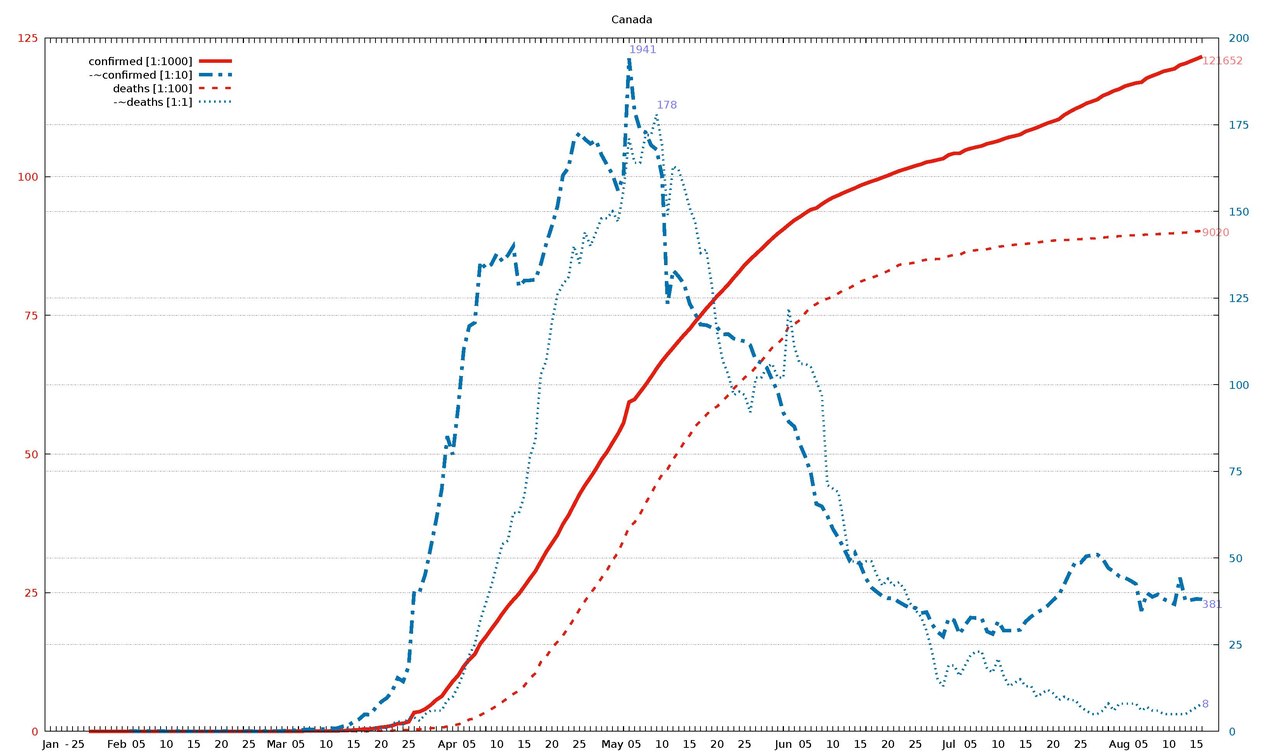
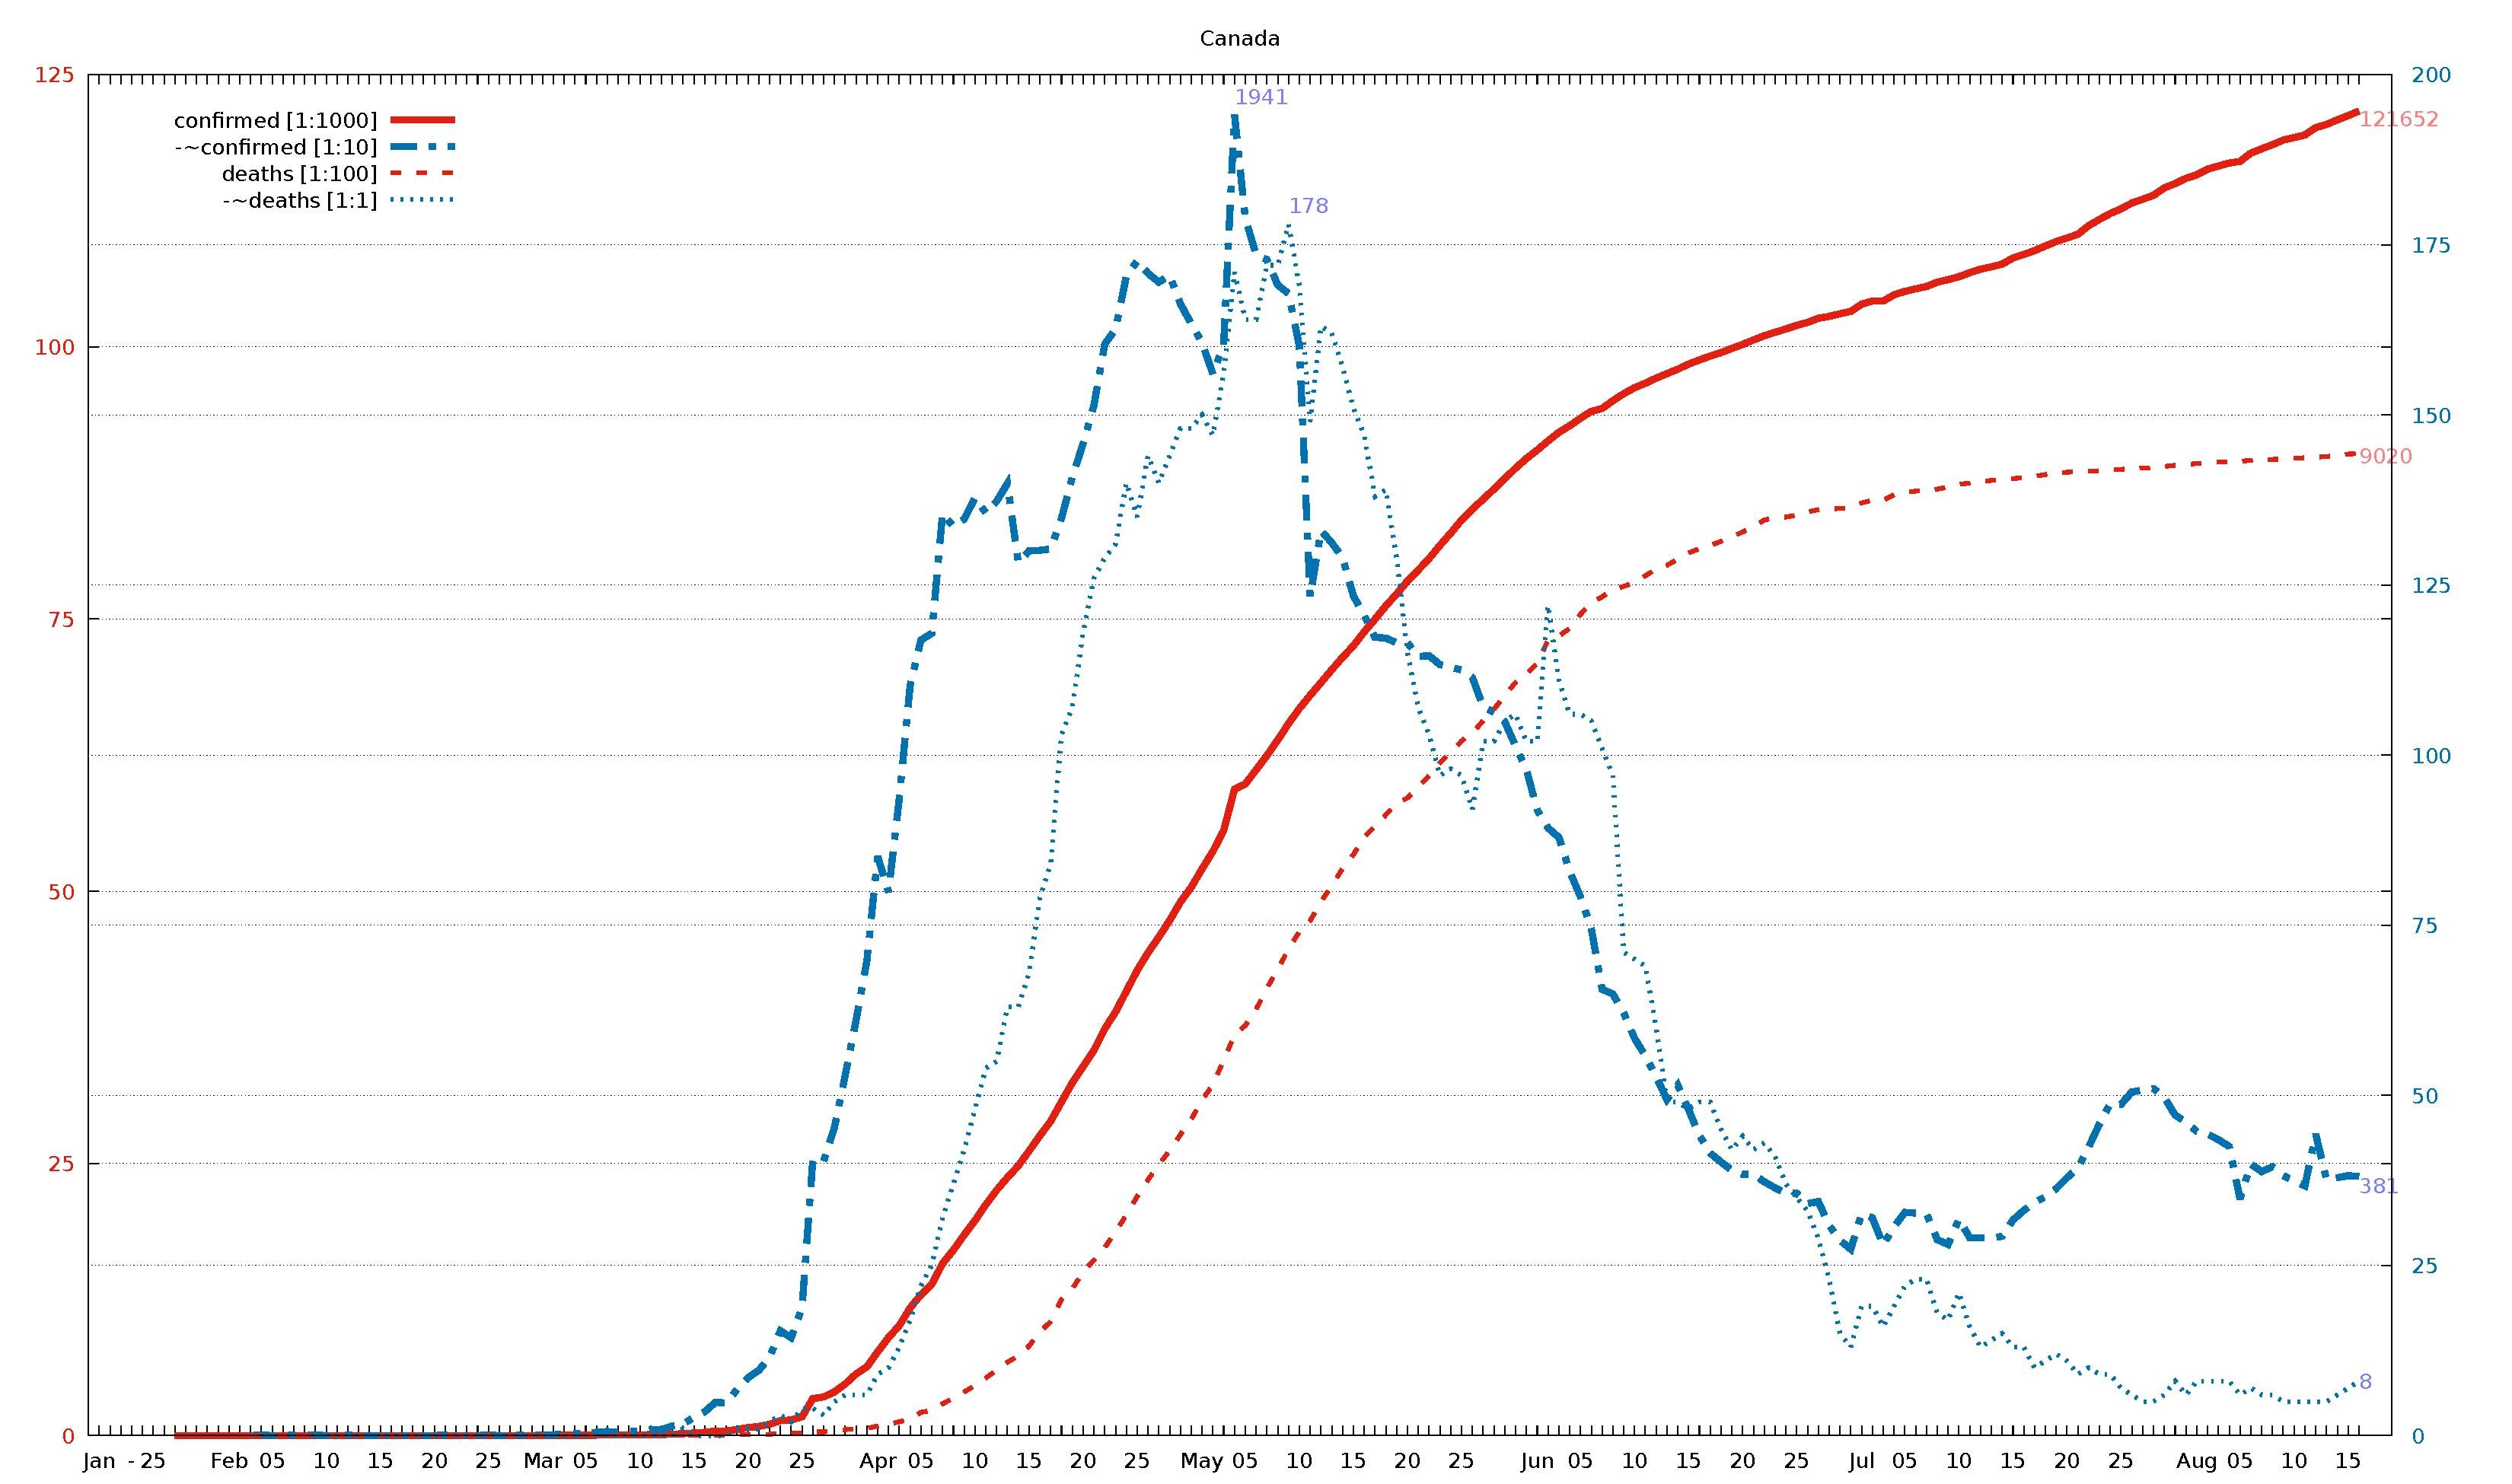
English: Diagram of WHO COVID-19 daily data (20 Jan - 16 Aug 2020) for "Total Confirmed Cases" (thick solid line), its smoothed increment (thick dash-dotted line), "Total Deaths" (thin dashed line) , and its smoothed increment (thin dotted line). Figures are taken from the available situation reports. Red and blue lines refer to the left and right vertical axis, respectively; the scaling factor for each curve is given in the legend. The horizontal axis starts on 20 Jan 2020 (situation report 1), and ends on 16 Aug 2020 (situation report 209). In the smoothed curves, for each day, 1/7 of the difference of the current day's figure and the figure a week ago is shown. For example, in situation report 115 (14 May 2020) and 121 (21 May 2020), there were 8676 and 5339 Total Confirmed Cases in Afghanistan, respectively, so the thick dash-dotted line passes through 477 = (8676-5339)/7 on 21 May.
For an overview of all related visualizations, and a more detailled description, see WHO Covid diagram set#Available country diagrams Jan-Aug 2020 (daily). |
| Date | |
| Source | Own work |
| Author | Jochen Burghardt |
Licensing[edit]
I, the copyright holder of this work, hereby publish it under the following license:
This file is licensed under the Creative Commons Attribution-Share Alike 4.0 International license.
- You are free:
- to share – to copy, distribute and transmit the work
- to remix – to adapt the work
- Under the following conditions:
- attribution – You must give appropriate credit, provide a link to the license, and indicate if changes were made. You may do so in any reasonable manner, but not in any way that suggests the licensor endorses you or your use.
- share alike – If you remix, transform, or build upon the material, you must distribute your contributions under the same or compatible license as the original.
Gnuplot source code[edit]
| Gnuplot source code |
|---|
set term pdf size 22,13
set term pdf font "sans,20"
set output "WHO_Covid_C_Canada.pdf"
set key autotitle columnhead
set termoption noenhanced
# (1) norm: 122 195 902 178
# (2) dist: 1,0:160 2,0:135 2,1:216 3,0:146 3,1:110 3,2:197
# (3,4) dist max: 216 2:902--1:195
# (4) right: 0 1 0 1
# (6,7) scMax: 125 200
# (8) scale: [1:1000] [1:10] [1:100] [1:1]


set xrange [-1:212]
set yrange [0:125]
set y2range [0:200]
set xtics 3650,100
set ytics 25 textcolor "#e51e10"
set y2tics 25 textcolor "#0072b2"
set grid y y2

set title "Canada"

$data <<EOF
rep day "confirmed [1:1000]" "-~confirmed [1:10]" "deaths [1:100]" "-~deaths [1:1]"
1	Jan	.	-	.	-
2	""	.	-	.	-
3	""	.	-	.	-
-	-	-	-	-	-
4	""	.	-	.	-
5	25	.	-	.	-
6	""	.	-	.	-
7	""	1	-	.	-
8	""	2	-	.	-
9	""	3	-	.	-
10	""	3	-	.	-
11	""	3	-	.	-
12	Feb	4	-	.	-
13	""	4	-	.	-
14	""	4	0	0	-
15	""	4	1	0	-
16	05	5	0	0	-
17	""	5	0	0	-
18	""	7	1	0	-
19	""	7	0	0	-
20	""	7	1	0	-
21	10	7	0	0	0
22	""	7	0	0	0
23	""	7	1	0	0
24	""	7	0	0	0
25	""	7	0	0	0
26	15	7	0	0	0
27	""	7	0	0	0
28	""	7	0	0	0
29	""	8	0	0	0
30	""	8	0	0	0
31	20	8	0	0	0
32	""	8	1	0	0
33	""	8	0	0	0
34	""	9	0	0	0
35	""	9	0	0	0
36	25	10	1	0	0
37	""	10	0	0	0
38	""	11	0	0	0
39	""	11	1	0	0
40	""	14	1	0	0
41	Mar	19	1	0	0
42	""	19	1	0	0
43	""	27	3	0	0
44	""	30	3	0	0
45	05	30	2	0	0
46	""	45	5	0	0
47	""	51	6	0	0
48	""	57	5	0	0
49	""	62	6	0	0
50	10	77	7	0	0
51	""	93	9	1	0
52	""	93	9	1	0
53	""	138	14	1	0
54	""	176	17	1	1
55	15	244	27	1	0
56	""	304	35	1	0
57	""	424	49	1	0
58	""	424	48	1	0
59	""	569	68	8	1
60	20	736	85	9	1
61	""	846	96	9	1
62	""	1048	115	13	2
63	""	1384	154	19	3
64	""	1432	144	20	2
65	25	1739	188	25	4
66	""	3409	405	35	4
67	""	3555	403	35	3
68	""	4018	453	39	5
69	""	4757	530	55	6
70	""	5655	610	61	6
71	""	6317	698	66	6
72	Apr	7695	851	89	9
73	""	9005	799	105	10
74	""	10114	937	127	13
75	""	11732	1102	152	17
76	05	12938	1169	214	22
77	""	13904	1179	231	25
78	""	15806	1355	293	32
79	""	17049	1336	345	37
80	""	18433	1347	401	42
81	10	19759	1378	461	48
82	""	21226	1356	531	54
83	""	22544	1373	600	55
84	""	23702	1399	674	63
85	""	24786	1283	734	63
86	15	26146	1300	823	68
87	""	27540	1301	954	79
88	""	28884	1303	1048	84
89	""	30659	1348	1250	103
90	""	32400	1408	1346	107
91	20	33909	1458	1506	118
92	""	35383	1514	1611	126
93	""	37374	1604	1728	129
94	""	38923	1626	1871	131
95	""	40813	1704	2028	140
96	25	42739	1726	2197	135
97	""	44353	1708	2350	144
98	""	45778	1695	2489	140
99	""	47316	1705	2617	144
100	""	49014	1663	2766	148
101	""	50363	1634	2904	148
102	May	52056	1606	3082	150
103	""	53657	1560	3223	147
104	""	55572	1603	3446	156
105	""	59365	1941	3681	171
106	05	59844	1789	3766	164
107	""	61159	1735	3915	164
108	""	62458	1728	4111	172
109	""	63895	1691	4280	172
110	""	65399	1678	4471	178
111	10	66780	1601	4628	169
112	""	67996	1233	4728	149
113	""	69156	1330	4906	163
114	""	70342	1312	5049	162
115	""	71486	1290	5209	157
116	15	72536	1234	5337	151
117	""	73829	1205	5499	147
118	""	74993	1173	5595	138
119	""	76204	1172	5702	139
120	""	77306	1165	5805	129
121	20	78499	1165	5857	115
122	""	79502	1145	5955	107
123	""	80555	1146	6062	103
124	""	81765	1133	6180	97
125	""	82892	1129	6277	98
126	25	84081	1125	6380	97
127	""	85103	1114	6453	92
128	""	85998	1071	6566	102
129	""	86939	1063	6671	102
130	""	87902	1049	6799	105
131	""	88856	1013	6918	106
132	""	89741	979	6996	102
133	Jun	90516	919	7092	102
134	""	91351	893	7305	122
135	""	92151	879	7344	111
136	""	92748	829	7414	106
137	05	93441	792	7543	106
138	""	94070	745	7652	105
139	""	94335	656	7703	101
140	""	95057	649	7773	97
141	""	95699	621	7800	71
142	10	96244	584	7835	70
143	""	96653	558	7897	69
144	""	97125	527	7960	60
145	""	97530	494	7994	49
146	""	97943	515	8049	49
147	15	98410	479	8107	48
148	""	98787	441	8146	49
149	""	99147	415	8175	49
150	""	99467	402	8213	45
151	""	99853	390	8254	42
152	20	100220	384	8300	44
153	""	100629	384	8346	42
154	""	101019	373	8410	43
155	""	101337	364	8430	41
156	""	101637	356	8436	37
157	25	101963	356	8454	35
158	""	102242	341	8484	33
159	""	102622	344	8504	29
160	""	102794	309	8508	23
161	""	103032	287	8516	15
162	""	103250	274	8522	13
163	Jul	103918	326	8566	19
164	""	104204	320	8591	19
165	""	104204	280	8591	16
166	""	104772	307	8642	19
167	05	105091	328	8663	22
168	""	105317	327	8674	23
169	""	105536	326	8684	23
170	""	105935	288	8693	18
171	""	106167	281	8711	17
172	10	106434	318	8737	21
173	""	106805	291	8749	16
174	""	107126	291	8759	13
175	""	107347	290	8773	14
176	""	107590	293	8783	15
177	15	108155	317	8790	13
178	""	108486	331	8798	13
179	""	108829	343	8810	10
180	""	109264	351	8827	11
181	""	109669	363	8839	12
182	20	109999	379	8848	11
183	""	110338	393	8852	9
184	""	111124	424	8858	10
185	""	111697	458	8862	9
186	""	112240	488	8870	9
187	25	112672	487	8874	7
188	""	113206	505	8881	6
189	""	113556	508	8885	5
190	""	113911	510	8890	5
191	""	114597	497	8901	6
192	""	114994	471	8912	8
193	""	115470	461	8917	6
194	Aug	115799	447	8929	8
195	""	116312	443	8935	8
196	""	116599	435	8941	8
197	""	116884	425	8945	8
198	05	117031	348	8947	6
199	""	117792	399	8958	7
200	""	118187	388	8962	6
201	""	118561	395	8966	6
202	""	118985	382	8970	5
203	10	119221	374	8976	5
204	""	119451	367	8981	5
205	""	120132	443	8987	5
206	""	120421	376	8991	5
207	""	120844	379	9006	6
208	15	121234	382	9015	7
209	""	121652	381	9020	8
EOF

# confirmed:
set label "121652 " at first 209,121           left back textcolor "#ff8080"
# -~confirmed:
set label "381    " at first 209, 38*125/200   left back textcolor "#8080ff"
set label "1941   " at first 105,194*125/200+2 left back textcolor "#8080ff"
# deaths:
set label "9020   " at first 209, 90           left back textcolor "#ff8080"
# -~deaths:
set label "8      " at first 209,  8*125/200   left back textcolor "#8080ff"
set label "178    " at first 110,178*125/200+2 left back textcolor "#8080ff"

set multiplot
  plot $data using 0:($3/   1000        ) with lines lc 7 lw 8 dt 1 title at 0.150, 0.920
replot $data using 0:($4/     10*125/200) with lines lc 6 lw 8 dt 4 title at 0.150, 0.902
replot $data using 0:($5/    100        ) with lines lc 7 lw 5 dt 2 title at 0.150, 0.884
replot $data using 0:($6/      1*125/200) with lines lc 6 lw 5 dt 3 title at 0.150, 0.866

# plot hor axis calendar
replot $data using 0:(0):xticlabel(2) with lines
|
File history
Click on a date/time to view the file as it appeared at that time.
| Date/Time | Thumbnail | Dimensions | User | Comment | |
|---|---|---|---|---|---|
| current | 18:55, 24 September 2020 |  | 3,300 × 1,950 (25 KB) | Jochen Burghardt (talk | contribs) | =={{int:filedesc}}== {{Information |description={{en|1=Diagram of WHO COVID-19 daily data (20 Jan - 16 Aug 2020) for ''"Total Confirmed Cases"'' (thick solid line), its smoothed increment (thick dash-dotted line), ''"Total Deaths"'' (thin dashed line), and its smoothed increment (thin dotted line); see File:WHO_Covid_2020_Jan-Aug_daily_C_Afghanistan.pdf for details.}} |date=2020-09-24 |source={{own}} |author=Jochen Burghardt |permission= |other_versions=[[:File:... |
You cannot overwrite this file.
File usage on Commons
There are no pages that use this file.