File:WHO Covid 2020 Jan-Aug daily C Chad.pdf
Jump to navigation
Jump to search

Size of this JPG preview of this PDF file: 800 × 473 pixels. Other resolutions: 320 × 189 pixels | 640 × 378 pixels | 1,024 × 605 pixels | 1,280 × 756 pixels | 3,300 × 1,950 pixels.
Original file (3,300 × 1,950 pixels, file size: 21 KB, MIME type: application/pdf)
Captions
Captions
Add a one-line explanation of what this file represents
Summary[edit]
| Description |
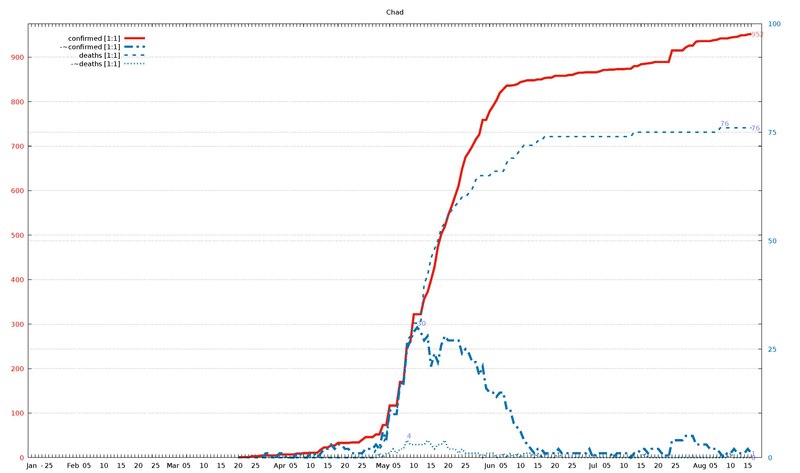
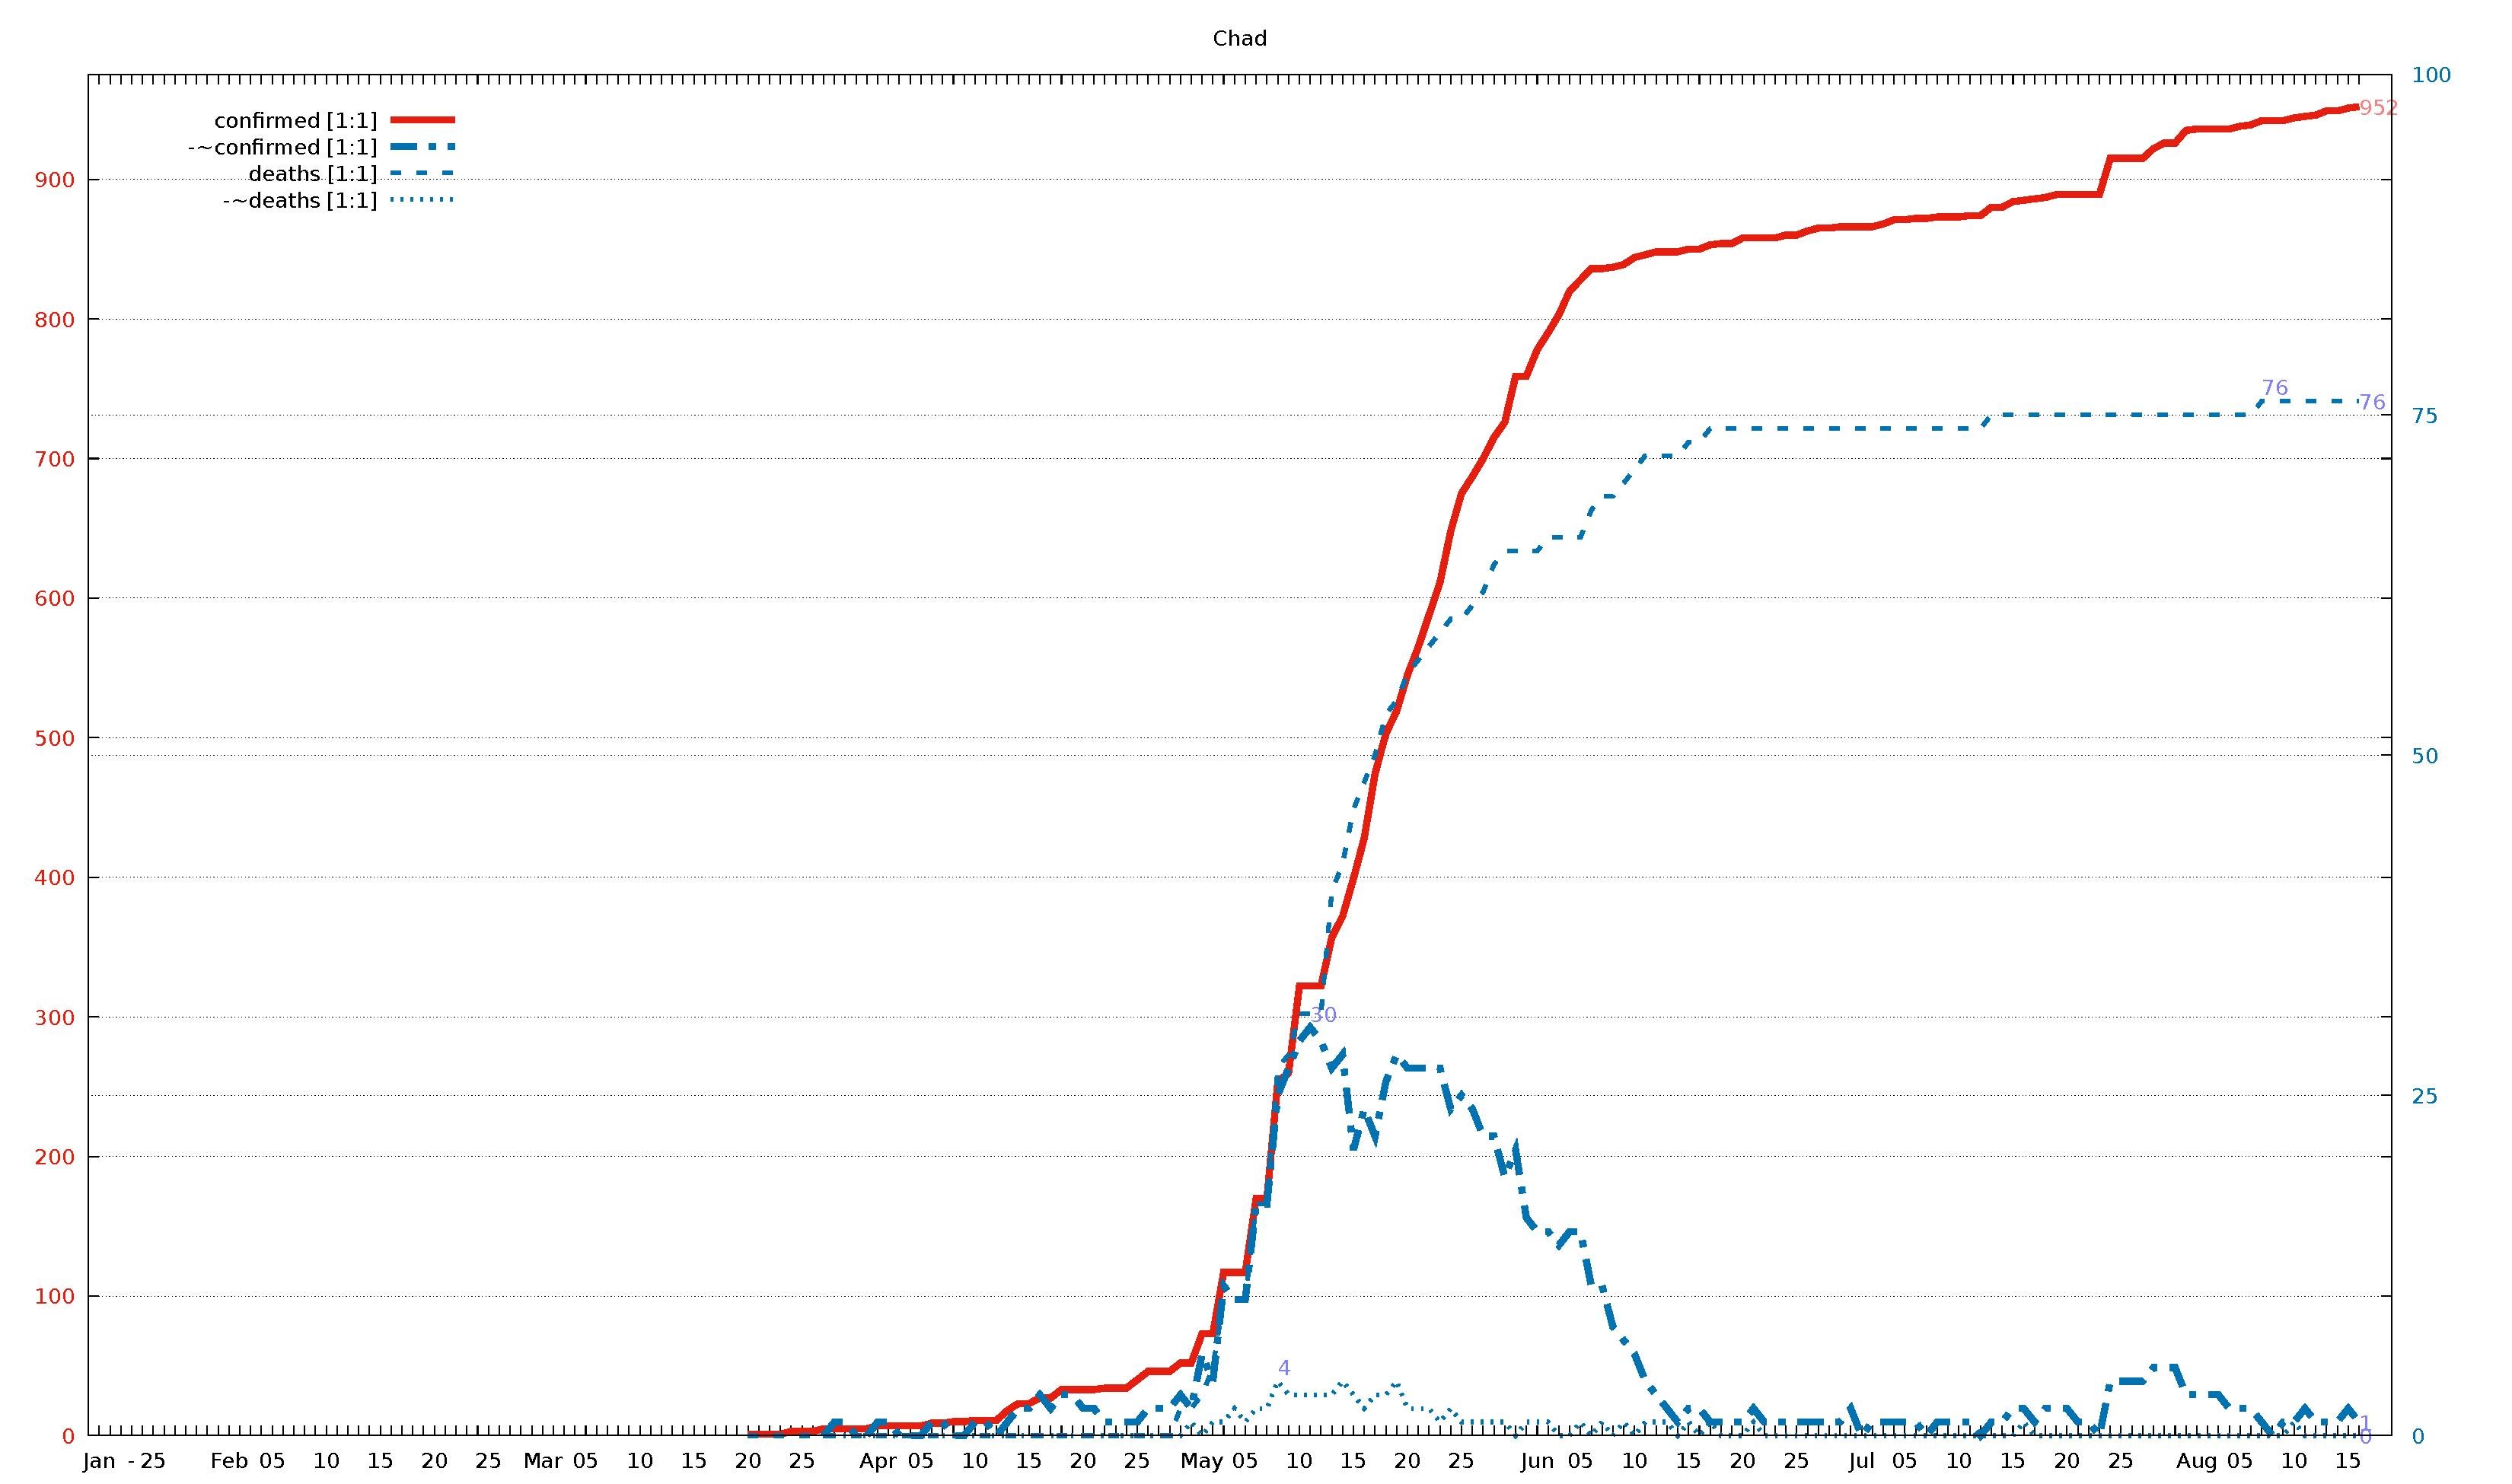
English: Diagram of WHO COVID-19 daily data (20 Jan - 16 Aug 2020) for "Total Confirmed Cases" (thick solid line), its smoothed increment (thick dash-dotted line), "Total Deaths" (thin dashed line) , and its smoothed increment (thin dotted line). Figures are taken from the available situation reports. Red and blue lines refer to the left and right vertical axis, respectively; the scaling factor for each curve is given in the legend. The horizontal axis starts on 20 Jan 2020 (situation report 1), and ends on 16 Aug 2020 (situation report 209). In the smoothed curves, for each day, 1/7 of the difference of the current day's figure and the figure a week ago is shown. For example, in situation report 115 (14 May 2020) and 121 (21 May 2020), there were 8676 and 5339 Total Confirmed Cases in Afghanistan, respectively, so the thick dash-dotted line passes through 477 = (8676-5339)/7 on 21 May.
For an overview of all related visualizations, and a more detailled description, see WHO Covid diagram set#Available country diagrams Jan-Aug 2020 (daily). |
| Date | |
| Source | Own work |
| Author | Jochen Burghardt |
Licensing[edit]
I, the copyright holder of this work, hereby publish it under the following license:
This file is licensed under the Creative Commons Attribution-Share Alike 4.0 International license.
- You are free:
- to share – to copy, distribute and transmit the work
- to remix – to adapt the work
- Under the following conditions:
- attribution – You must give appropriate credit, provide a link to the license, and indicate if changes were made. You may do so in any reasonable manner, but not in any way that suggests the licensor endorses you or your use.
- share alike – If you remix, transform, or build upon the material, you must distribute your contributions under the same or compatible license as the original.
Gnuplot source code[edit]
| Gnuplot source code |
|---|
set term pdf size 22,13
set term pdf font "sans,20"
set output "WHO_Covid_C_Chad.pdf"
set key autotitle columnhead
set termoption noenhanced
# (1) norm: 952 001 001 001

set xrange [-1:212]
set yrange [0:975]
set y2range [0:100]
set xtics 3650,100
set ytics 100 textcolor "#e51e10"
set y2tics 25 textcolor "#0072b2"
set grid y y2

set title "Chad"

$data <<EOF
rep day "confirmed [1:1]" "-~confirmed [1:1]" "deaths [1:1]" "-~deaths [1:1]"
1	Jan	.	-	.	-
2	""	.	-	.	-
3	""	.	-	.	-
-	-	-	-	-	-
4	""	.	-	.	-
5	25	.	-	.	-
6	""	.	-	.	-
7	""	.	-	.	-
8	""	.	-	.	-
9	""	.	-	.	-
10	""	.	-	.	-
11	""	.	-	.	-
12	Feb	.	-	.	-
13	""	.	-	.	-
14	""	.	-	.	-
15	""	.	-	.	-
16	05	.	-	.	-
17	""	.	-	.	-
18	""	.	-	.	-
19	""	.	-	.	-
20	""	.	-	.	-
21	10	.	-	.	-
22	""	.	-	.	-
23	""	.	-	.	-
24	""	.	-	.	-
25	""	.	-	.	-
26	15	.	-	.	-
27	""	.	-	.	-
28	""	.	-	.	-
29	""	.	-	.	-
30	""	.	-	.	-
31	20	.	-	.	-
32	""	.	-	.	-
33	""	.	-	.	-
34	""	.	-	.	-
35	""	.	-	.	-
36	25	.	-	.	-
37	""	.	-	.	-
38	""	.	-	.	-
39	""	.	-	.	-
40	""	.	-	.	-
41	Mar	.	-	.	-
42	""	.	-	.	-
43	""	.	-	.	-
44	""	.	-	.	-
45	05	.	-	.	-
46	""	.	-	.	-
47	""	.	-	.	-
48	""	.	-	.	-
49	""	.	-	.	-
50	10	.	-	.	-
51	""	.	-	.	-
52	""	.	-	.	-
53	""	.	-	.	-
54	""	.	-	.	-
55	15	.	-	.	-
56	""	.	-	.	-
57	""	.	-	.	-
58	""	.	-	.	-
59	""	.	-	.	-
60	20	1	-	0	-
61	""	1	-	0	-
62	""	1	-	0	-
63	""	1	-	0	-
64	""	3	-	0	-
65	25	3	-	0	-
66	""	3	-	0	-
67	""	5	0	0	0
68	""	5	1	0	0
69	""	5	1	0	0
70	""	5	0	0	0
71	""	5	0	0	0
72	Apr	7	1	0	0
73	""	7	1	0	0
74	""	7	0	0	0
75	""	7	0	0	0
76	05	7	0	0	0
77	""	9	1	0	0
78	""	9	1	0	0
79	""	10	0	0	0
80	""	10	0	0	0
81	10	11	1	0	0
82	""	11	1	0	0
83	""	11	0	0	0
84	""	18	1	0	0
85	""	23	2	0	0
86	15	23	2	0	0
87	""	27	3	0	0
88	""	27	2	0	0
89	""	33	3	0	0
90	""	33	3	0	0
91	20	33	2	0	0
92	""	33	2	0	0
93	""	34	1	0	0
94	""	34	1	0	0
95	""	34	1	0	0
96	25	40	1	0	0
97	""	46	2	0	0
98	""	46	2	0	0
99	""	46	2	0	0
100	""	52	3	2	0
101	""	52	2	2	1
102	May	73	6	3	0
103	""	73	4	5	1
104	""	117	11	10	1
105	""	117	10	10	2
106	05	117	10	10	1
107	""	170	17	17	2
108	""	170	17	17	2
109	""	253	25	27	4
110	""	260	27	28	3
111	10	322	29	31	3
112	""	322	30	31	3
113	""	322	29	31	3
114	""	357	27	40	3
115	""	372	28	42	4
116	15	399	21	46	3
117	""	428	24	48	2
118	""	474	22	50	3
119	""	503	26	53	3
120	""	519	28	54	4
121	20	545	27	56	2
122	""	565	27	57	2
123	""	588	27	58	2
124	""	611	27	59	1
125	""	648	24	60	2
126	25	675	25	60	1
127	""	687	24	61	1
128	""	700	22	62	1
129	""	715	22	64	1
130	""	726	19	65	1
131	""	759	21	65	0
132	""	759	16	65	1
133	Jun	778	15	65	1
134	""	790	15	66	1
135	""	803	14	66	0
136	""	820	15	66	0
137	05	828	15	66	1
138	""	836	11	68	0
139	""	836	11	69	1
140	""	837	8	69	0
141	""	839	7	70	1
142	10	844	6	71	0
143	""	846	4	72	1
144	""	848	3	72	1
145	""	848	2	72	1
146	""	848	1	72	0
147	15	850	2	73	1
148	""	850	2	73	0
149	""	853	1	74	1
150	""	854	1	74	0
151	""	854	1	74	0
152	20	858	1	74	0
153	""	858	2	74	1
154	""	858	1	74	0
155	""	858	1	74	0
156	""	860	1	74	0
157	25	860	1	74	0
158	""	863	1	74	0
159	""	865	1	74	0
160	""	865	1	74	0
161	""	866	1	74	0
162	""	866	2	74	0
163	Jul	866	0	74	0
164	""	866	1	74	0
165	""	868	1	74	0
166	""	871	1	74	0
167	05	871	1	74	0
168	""	872	1	74	0
169	""	872	0	74	0
170	""	873	1	74	0
171	""	873	1	74	0
172	10	873	1	74	0
173	""	874	1	74	0
174	""	874	0	74	0
175	""	880	1	75	0
176	""	880	1	75	0
177	15	884	2	75	0
178	""	885	2	75	1
179	""	886	1	75	0
180	""	887	2	75	0
181	""	889	2	75	0
182	20	889	2	75	0
183	""	889	1	75	0
184	""	889	1	75	0
185	""	889	0	75	0
186	""	915	4	75	0
187	25	915	4	75	0
188	""	915	4	75	0
189	""	915	4	75	0
190	""	922	5	75	0
191	""	926	5	75	0
192	""	926	5	75	0
193	""	935	3	75	0
194	Aug	936	3	75	0
195	""	936	3	75	0
196	""	936	3	75	0
197	""	936	2	75	0
198	05	938	2	75	0
199	""	939	2	75	0
200	""	942	1	76	0
201	""	942	0	76	0
202	""	942	1	76	0
203	10	944	1	76	1
204	""	945	2	76	0
205	""	946	1	76	0
206	""	949	1	76	0
207	""	949	1	76	0
208	15	951	2	76	0
209	""	952	1	76	0
EOF

# confirmed:
set label "952    " at first 209,952           left back textcolor "#ff8080"
# -~confirmed:
set label "1      " at first 209,  1*975/100   left back textcolor "#8080ff"
set label "30     " at first 112, 30*975/100+10 left back textcolor "#8080ff"
# deaths:
set label "76     " at first 209, 76*975/100   left back textcolor "#8080ff"
set label "76     " at first 200, 76*975/100+10 left back textcolor "#8080ff"
# -~deaths:
set label "0      " at first 209,  0*975/100   left back textcolor "#8080ff"
set label "4      " at first 109,  4*975/100+10 left back textcolor "#8080ff"

set multiplot
  plot $data using 0:($3/      1        ) with lines lc 7 lw 8 dt 1 title at 0.150, 0.920
replot $data using 0:($4/      1*975/100) with lines lc 6 lw 8 dt 4 title at 0.150, 0.902
replot $data using 0:($5/      1*975/100) with lines lc 6 lw 5 dt 2 title at 0.150, 0.884
replot $data using 0:($6/      1*975/100) with lines lc 6 lw 5 dt 3 title at 0.150, 0.866

# plot hor axis calendar
replot $data using 0:(0):xticlabel(2) with lines
|
File history
Click on a date/time to view the file as it appeared at that time.
| Date/Time | Thumbnail | Dimensions | User | Comment | |
|---|---|---|---|---|---|
| current | 18:56, 24 September 2020 |  | 3,300 × 1,950 (21 KB) | Jochen Burghardt (talk | contribs) | =={{int:filedesc}}== {{Information |description={{en|1=Diagram of WHO COVID-19 daily data (20 Jan - 16 Aug 2020) for ''"Total Confirmed Cases"'' (thick solid line), its smoothed increment (thick dash-dotted line), ''"Total Deaths"'' (thin dashed line), and its smoothed increment (thin dotted line); see File:WHO_Covid_2020_Jan-Aug_daily_C_Afghanistan.pdf for details.}} |date=2020-09-24 |source={{own}} |author=Jochen Burghardt |permission= |other_versions=[[:File:... |
You cannot overwrite this file.
File usage on Commons
There are no pages that use this file.