File:WHO Covid 2020 Jan-Aug daily C Colombia.pdf
Jump to navigation
Jump to search

Size of this JPG preview of this PDF file: 800 × 473 pixels. Other resolutions: 320 × 189 pixels | 640 × 378 pixels | 1,024 × 605 pixels | 1,280 × 756 pixels | 3,300 × 1,950 pixels.
Original file (3,300 × 1,950 pixels, file size: 24 KB, MIME type: application/pdf)
Captions
Captions
Add a one-line explanation of what this file represents
Summary[edit]
| Description |
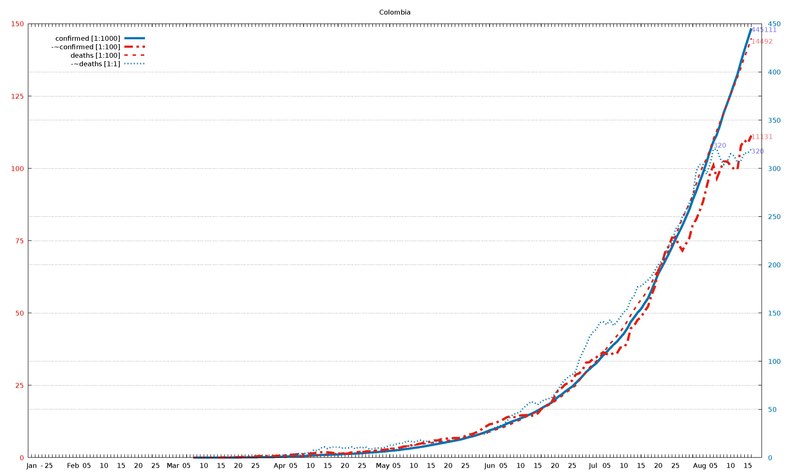
English: Diagram of WHO COVID-19 daily data (20 Jan - 16 Aug 2020) for "Total Confirmed Cases" (thick solid line), its smoothed increment (thick dash-dotted line), "Total Deaths" (thin dashed line) , and its smoothed increment (thin dotted line). Figures are taken from the available situation reports. Red and blue lines refer to the left and right vertical axis, respectively; the scaling factor for each curve is given in the legend. The horizontal axis starts on 20 Jan 2020 (situation report 1), and ends on 16 Aug 2020 (situation report 209). In the smoothed curves, for each day, 1/7 of the difference of the current day's figure and the figure a week ago is shown. For example, in situation report 115 (14 May 2020) and 121 (21 May 2020), there were 8676 and 5339 Total Confirmed Cases in Afghanistan, respectively, so the thick dash-dotted line passes through 477 = (8676-5339)/7 on 21 May.
For an overview of all related visualizations, and a more detailled description, see WHO Covid diagram set#Available country diagrams Jan-Aug 2020 (daily). |
| Date | |
| Source | Own work |
| Author | Jochen Burghardt |
Licensing[edit]
I, the copyright holder of this work, hereby publish it under the following license:
This file is licensed under the Creative Commons Attribution-Share Alike 4.0 International license.
- You are free:
- to share – to copy, distribute and transmit the work
- to remix – to adapt the work
- Under the following conditions:
- attribution – You must give appropriate credit, provide a link to the license, and indicate if changes were made. You may do so in any reasonable manner, but not in any way that suggests the licensor endorses you or your use.
- share alike – If you remix, transform, or build upon the material, you must distribute your contributions under the same or compatible license as the original.
Gnuplot source code[edit]
| Gnuplot source code |
|---|
set term pdf size 22,13
set term pdf font "sans,20"
set output "WHO_Covid_C_Colombia.pdf"
set key autotitle columnhead
set termoption noenhanced
# (1) norm: 446 112 145 320
# (2) dist: 1,0:251 2,0:308 2,1:130 3,0:140 3,1:286 3,2:221
# (3,4) dist max: 308 2:145--0:446
# (4) right: 1 0 0 1
# (6,7) scMax: 150 450
# (8) scale: [1:1000] [1:100] [1:100] [1:1]


set xrange [-1:212]
set yrange [0:150]
set y2range [0:450]
set xtics 3650,100
set ytics 25 textcolor "#e51e10"
set y2tics 50 textcolor "#0072b2"
set grid y y2

set title "Colombia"

$data <<EOF
rep day "confirmed [1:1000]" "-~confirmed [1:100]" "deaths [1:100]" "-~deaths [1:1]"
1	Jan	.	-	.	-
2	""	.	-	.	-
3	""	.	-	.	-
-	-	-	-	-	-
4	""	.	-	.	-
5	25	.	-	.	-
6	""	.	-	.	-
7	""	.	-	.	-
8	""	.	-	.	-
9	""	.	-	.	-
10	""	.	-	.	-
11	""	.	-	.	-
12	Feb	.	-	.	-
13	""	.	-	.	-
14	""	.	-	.	-
15	""	.	-	.	-
16	05	.	-	.	-
17	""	.	-	.	-
18	""	.	-	.	-
19	""	.	-	.	-
20	""	.	-	.	-
21	10	.	-	.	-
22	""	.	-	.	-
23	""	.	-	.	-
24	""	.	-	.	-
25	""	.	-	.	-
26	15	.	-	.	-
27	""	.	-	.	-
28	""	.	-	.	-
29	""	.	-	.	-
30	""	.	-	.	-
31	20	.	-	.	-
32	""	.	-	.	-
33	""	.	-	.	-
34	""	.	-	.	-
35	""	.	-	.	-
36	25	.	-	.	-
37	""	.	-	.	-
38	""	.	-	.	-
39	""	.	-	.	-
40	""	.	-	.	-
41	Mar	.	-	.	-
42	""	.	-	.	-
43	""	.	-	.	-
44	""	.	-	.	-
45	05	.	-	.	-
46	""	.	-	.	-
47	""	1	-	0	-
48	""	1	-	0	-
49	""	1	-	0	-
50	10	3	-	0	-
51	""	3	-	0	-
52	""	9	-	0	-
53	""	9	-	0	-
54	""	16	2	0	0
55	15	24	3	0	0
56	""	24	4	0	0
57	""	45	6	0	0
58	""	45	6	0	0
59	""	93	12	0	0
60	20	108	14	0	0
61	""	145	18	0	0
62	""	196	25	0	0
63	""	196	24	2	0
64	""	277	33	3	1
65	25	306	38	3	0
66	""	470	54	4	1
67	""	470	51	4	0
68	""	491	50	6	1
69	""	539	49	6	1
70	""	608	59	6	1
71	""	702	60	10	1
72	Apr	798	71	14	1
73	""	906	62	16	2
74	""	1065	85	17	2
75	""	1161	96	19	2
76	05	1267	104	25	2
77	""	1406	114	32	4
78	""	1485	111	35	4
79	""	1579	112	46	4
80	""	1780	125	50	5
81	10	2054	141	55	5
82	""	2223	152	69	8
83	""	2473	172	80	7
84	""	2709	186	100	10
85	""	2776	185	109	11
86	15	2852	182	112	9
87	""	2979	171	127	11
88	""	3105	150	131	11
89	""	3233	144	144	11
90	""	3439	138	153	10
91	20	3621	131	166	10
92	""	3792	145	179	10
93	""	3977	160	189	11
94	""	4149	168	196	9
95	""	4356	178	206	11
96	25	4561	190	215	10
97	""	4881	206	225	11
98	""	5142	217	233	9
99	""	5379	227	244	9
100	""	5597	231	253	10
101	""	5949	258	269	10
102	May	6211	265	278	10
103	""	6507	278	293	11
104	""	7006	303	314	13
105	""	7285	306	324	13
106	05	7668	327	340	14
107	""	7973	340	358	15
108	""	8613	380	378	15
109	""	8959	393	397	17
110	""	9456	421	407	17
111	10	10051	435	428	16
112	""	10495	459	445	17
113	""	11063	485	463	18
114	""	11613	520	479	17
115	""	12272	522	493	17
116	15	12930	568	509	16
117	""	13610	593	525	16
118	""	14216	595	546	17
119	""	14939	635	562	17
120	""	15574	644	574	16
121	20	16295	669	592	16
122	""	16935	666	613	17
123	""	17687	680	630	17
124	""	18330	674	652	19
125	""	19131	702	682	19
126	25	20177	749	705	20
127	""	21175	800	727	22
128	""	21981	812	750	23
129	""	23003	867	776	23
130	""	24104	917	803	25
131	""	25366	1005	822	24
132	""	26688	1079	853	25
133	Jun	28236	1152	890	26
134	""	29383	1172	939	30
135	""	30493	1216	969	32
136	""	31833	1262	1009	33
137	05	33354	1321	1045	34
138	""	35120	1394	1087	38
139	""	36635	1421	1145	42
140	""	38027	1398	1205	45
141	""	39236	1408	1259	46
142	10	40719	1461	1308	48
143	""	42078	1463	1372	52
144	""	43682	1476	1433	55
145	""	45212	1441	1488	58
146	""	46858	1461	1545	57
147	15	48746	1531	1592	55
148	""	50939	1672	1667	58
149	""	53063	1763	1726	60
150	""	54931	1837	1801	61
151	""	57046	1909	1864	62
152	20	60217	2143	1950	66
153	""	63276	2346	2045	71
154	""	65633	2412	2126	77
155	""	68652	2531	2237	81
156	""	71183	2588	2310	84
157	25	73572	2663	2404	86
158	""	77113	2867	2491	89
159	""	80599	2912	2654	101
160	""	84442	3023	2811	109
161	""	88591	3280	2939	116
162	""	91769	3302	3106	125
163	Jul	95043	3409	3223	130
164	""	97846	3468	3334	133
165	""	102009	3556	3470	140
166	""	106110	3645	3641	141
167	05	109505	3580	3777	138
168	""	113389	3543	3942	143
169	""	117110	3620	4064	137
170	""	120281	3605	4210	141
171	""	124494	3807	4359	146
172	10	128638	3804	4527	151
173	""	133973	3981	4714	154
174	""	140776	4467	4925	164
175	""	145362	4568	5119	168
176	""	150445	4762	5307	177
177	15	154277	4856	5455	178
178	""	159898	5058	5625	181
179	""	165169	5219	5814	184
180	""	173206	5604	6029	188
181	""	182140	5910	6288	194
182	20	190700	6476	6516	200
183	""	197278	6691	6736	204
184	""	204005	7104	6929	211
185	""	211038	7306	7166	220
186	""	218428	7608	7373	223
187	25	226373	7595	7688	237
188	""	233541	7343	7975	241
189	""	240795	7157	8269	250
190	""	248976	7385	8525	256
191	""	257101	7585	8777	264
192	""	267385	8050	9074	272
193	""	276055	8232	9454	297
194	Aug	286020	8521	9810	304
195	""	295508	8853	10105	304
196	""	306181	9341	10330	294
197	""	317651	9810	10650	304
198	05	327850	10107	11017	320
199	""	334979	9657	11315	320
200	""	345714	9951	11624	310
201	""	357710	10241	11939	304
202	""	367196	10241	12250	307
203	10	376870	10099	12540	315
204	""	387481	9976	12842	313
205	""	397623	9967	13154	306
206	""	410453	10782	13475	308
207	""	422519	10972	13837	316
208	15	433805	10871	14145	316
209	""	445111	11131	14492	320
EOF

# confirmed:
set label "445111 " at first 209,445*150/450   left back textcolor "#8080ff"
# -~confirmed:
set label "11131  " at first 209,111           left back textcolor "#ff8080"
# deaths:
set label "14492  " at first 209,144           left back textcolor "#ff8080"
# -~deaths:
set label "320    " at first 209,320*150/450   left back textcolor "#8080ff"
set label "320    " at first 198,320*150/450+2 left back textcolor "#8080ff"

set multiplot
  plot $data using 0:($3/   1000*150/450) with lines lc 6 lw 8 dt 1 title at 0.150, 0.920
replot $data using 0:($4/    100        ) with lines lc 7 lw 8 dt 4 title at 0.150, 0.902
replot $data using 0:($5/    100        ) with lines lc 7 lw 5 dt 2 title at 0.150, 0.884
replot $data using 0:($6/      1*150/450) with lines lc 6 lw 5 dt 3 title at 0.150, 0.866

# plot hor axis calendar
replot $data using 0:(0):xticlabel(2) with lines
|
File history
Click on a date/time to view the file as it appeared at that time.
| Date/Time | Thumbnail | Dimensions | User | Comment | |
|---|---|---|---|---|---|
| current | 18:57, 24 September 2020 |  | 3,300 × 1,950 (24 KB) | Jochen Burghardt (talk | contribs) | =={{int:filedesc}}== {{Information |description={{en|1=Diagram of WHO COVID-19 daily data (20 Jan - 16 Aug 2020) for ''"Total Confirmed Cases"'' (thick solid line), its smoothed increment (thick dash-dotted line), ''"Total Deaths"'' (thin dashed line), and its smoothed increment (thin dotted line); see File:WHO_Covid_2020_Jan-Aug_daily_C_Afghanistan.pdf for details.}} |date=2020-09-24 |source={{own}} |author=Jochen Burghardt |permission= |other_versions=[[:File:... |
You cannot overwrite this file.
File usage on Commons
There are no pages that use this file.