File:WHO Covid 2020 Jan-Aug daily C Denmark.pdf
Jump to navigation
Jump to search

Size of this JPG preview of this PDF file: 800 × 473 pixels. Other resolutions: 320 × 189 pixels | 640 × 378 pixels | 1,024 × 605 pixels | 1,280 × 756 pixels | 3,300 × 1,950 pixels.
Original file (3,300 × 1,950 pixels, file size: 24 KB, MIME type: application/pdf)
Captions
Captions
Add a one-line explanation of what this file represents
Summary[edit]
| Description |
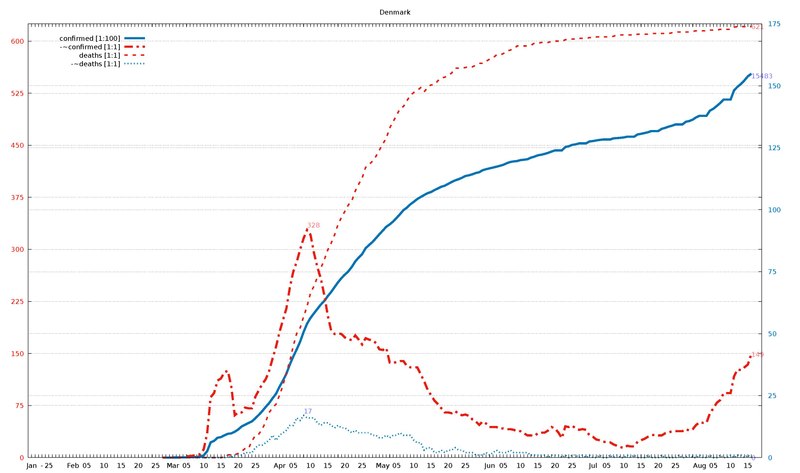
English: Diagram of WHO COVID-19 daily data (20 Jan - 16 Aug 2020) for "Total Confirmed Cases" (thick solid line), its smoothed increment (thick dash-dotted line), "Total Deaths" (thin dashed line) , and its smoothed increment (thin dotted line). Figures are taken from the available situation reports. Red and blue lines refer to the left and right vertical axis, respectively; the scaling factor for each curve is given in the legend. The horizontal axis starts on 20 Jan 2020 (situation report 1), and ends on 16 Aug 2020 (situation report 209). In the smoothed curves, for each day, 1/7 of the difference of the current day's figure and the figure a week ago is shown. For example, in situation report 115 (14 May 2020) and 121 (21 May 2020), there were 8676 and 5339 Total Confirmed Cases in Afghanistan, respectively, so the thick dash-dotted line passes through 477 = (8676-5339)/7 on 21 May.
For an overview of all related visualizations, and a more detailled description, see WHO Covid diagram set#Available country diagrams Jan-Aug 2020 (daily). |
| Date | |
| Source | Own work |
| Author | Jochen Burghardt |
Licensing[edit]
I, the copyright holder of this work, hereby publish it under the following license:
This file is licensed under the Creative Commons Attribution-Share Alike 4.0 International license.
- You are free:
- to share – to copy, distribute and transmit the work
- to remix – to adapt the work
- Under the following conditions:
- attribution – You must give appropriate credit, provide a link to the license, and indicate if changes were made. You may do so in any reasonable manner, but not in any way that suggests the licensor endorses you or your use.
- share alike – If you remix, transform, or build upon the material, you must distribute your contributions under the same or compatible license as the original.
Gnuplot source code[edit]
| Gnuplot source code |
|---|
set term pdf size 22,13
set term pdf font "sans,20"
set output "WHO_Covid_C_Denmark.pdf"
set key autotitle columnhead
set termoption noenhanced
# (1) norm: 155 328 621 001
# (2) dist: 1,0:212 2,0:249 2,1:190
# (3,4) dist max: 249 2:621--0:155
# (4) right: 1 0 0 1
# (6,7) scMax: 625 175
# (8) scale: [1:100] [1:1] [1:1] [1:1]


set xrange [-1:212]
set yrange [0:625]
set y2range [0:175]
set xtics 3650,100
set ytics 75 textcolor "#e51e10"
set y2tics 25 textcolor "#0072b2"
set grid y y2

set title "Denmark"

$data <<EOF
rep day "confirmed [1:100]" "-~confirmed [1:1]" "deaths [1:1]" "-~deaths [1:1]"
1	Jan	.	-	.	-
2	""	.	-	.	-
3	""	.	-	.	-
-	-	-	-	-	-
4	""	.	-	.	-
5	25	.	-	.	-
6	""	.	-	.	-
7	""	.	-	.	-
8	""	.	-	.	-
9	""	.	-	.	-
10	""	.	-	.	-
11	""	.	-	.	-
12	Feb	.	-	.	-
13	""	.	-	.	-
14	""	.	-	.	-
15	""	.	-	.	-
16	05	.	-	.	-
17	""	.	-	.	-
18	""	.	-	.	-
19	""	.	-	.	-
20	""	.	-	.	-
21	10	.	-	.	-
22	""	.	-	.	-
23	""	.	-	.	-
24	""	.	-	.	-
25	""	.	-	.	-
26	15	.	-	.	-
27	""	.	-	.	-
28	""	.	-	.	-
29	""	.	-	.	-
30	""	.	-	.	-
31	20	.	-	.	-
32	""	.	-	.	-
33	""	.	-	.	-
34	""	.	-	.	-
35	""	.	-	.	-
36	25	.	-	.	-
37	""	.	-	.	-
38	""	1	-	0	-
39	""	1	-	0	-
40	""	2	-	0	-
41	Mar	3	-	0	-
42	""	4	-	0	-
43	""	5	-	0	-
44	""	8	-	0	-
45	05	10	2	0	0
46	""	18	2	0	0
47	""	23	3	0	0
48	""	31	4	0	0
49	""	36	5	0	0
50	10	90	12	0	0
51	""	262	36	0	0
52	""	615	87	0	0
53	""	674	93	0	0
54	""	801	111	0	0
55	15	827	114	0	0
56	""	898	123	1	0
57	""	960	125	4	1
58	""	977	102	4	0
59	""	1044	61	4	1
60	20	1132	65	6	1
61	""	1255	65	9	1
62	""	1326	72	13	2
63	""	1395	71	13	2
64	""	1460	71	24	2
65	25	1591	88	32	4
66	""	1724	97	34	5
67	""	1877	106	41	5
68	""	2046	113	52	6
69	""	2201	125	65	7
70	""	2395	143	72	9
71	""	2577	160	77	7
72	Apr	2860	181	90	9
73	""	3107	198	104	10
74	""	3386	215	123	11
75	""	3757	245	139	13
76	05	4077	268	161	13
77	""	4369	282	179	16
78	""	4681	300	187	15
79	""	5071	316	203	17
80	""	5402	328	218	16
81	10	5635	321	237	16
82	""	5819	295	247	16
83	""	5996	274	260	14
84	""	6174	258	273	13
85	""	6318	234	285	14
86	15	6511	205	299	14
87	""	6681	183	309	13
88	""	6879	178	321	12
89	""	7073	179	336	13
90	""	7242	178	346	12
91	20	7384	173	355	12
92	""	7515	171	364	11
93	""	7695	169	370	10
94	""	7912	176	384	11
95	""	8073	170	394	10
96	25	8210	163	403	10
97	""	8445	172	418	10
98	""	8575	170	422	10
99	""	8698	169	427	9
100	""	8851	165	434	9
101	""	9008	156	443	8
102	May	9158	155	452	8
103	""	9311	158	460	9
104	""	9407	137	475	8
105	""	9523	136	484	9
106	05	9670	138	493	9
107	""	9821	139	503	10
108	""	9983	139	506	9
109	""	10083	132	514	9
110	""	10218	130	522	9
111	10	10319	130	526	7
112	""	10429	130	529	6
113	""	10513	120	533	6
114	""	10591	110	527	3
115	""	10667	98	533	4
116	15	10713	90	537	4
117	""	10791	82	537	2
118	""	10858	77	543	2
119	""	10927	71	547	3
120	""	10968	65	548	2
121	20	11044	65	551	3
122	""	11117	64	554	3
123	""	11182	67	561	4
124	""	11230	63	561	3
125	""	11289	61	561	3
126	25	11360	62	562	2
127	""	11387	60	563	2
128	""	11428	55	563	2
129	""	11480	52	565	1
130	""	11512	47	568	1
131	""	11593	52	568	1
132	""	11633	49	571	2
133	Jun	11669	44	574	1
134	""	11699	44	576	2
135	""	11734	44	580	3
136	""	11771	42	580	2
137	05	11811	42	582	2
138	""	11875	41	586	2
139	""	11924	41	587	3
140	""	11948	40	589	2
141	""	11962	38	593	2
142	10	12001	38	593	2
143	""	12016	35	593	2
144	""	12035	32	593	2
145	""	12099	32	594	1
146	""	12139	31	597	1
147	15	12193	35	597	1
148	""	12217	36	598	1
149	""	12250	36	598	1
150	""	12294	39	598	0
151	""	12344	44	600	1
152	20	12391	42	600	1
153	""	12391	36	600	1
154	""	12391	28	600	0
155	""	12527	45	602	1
156	""	12561	44	603	0
157	25	12615	46	603	1
158	""	12636	42	603	1
159	""	12675	40	604	0
160	""	12675	41	604	1
161	""	12675	40	604	0
162	""	12751	32	605	1
163	Jul	12768	30	605	0
164	""	12794	26	606	0
165	""	12815	25	606	1
166	""	12832	23	606	0
167	05	12832	22	606	0
168	""	12832	22	606	1
169	""	12878	19	607	0
170	""	12888	17	609	1
171	""	12900	15	609	0
172	10	12916	14	609	0
173	""	12946	17	609	1
174	""	12946	16	609	0
175	""	12946	16	609	1
176	""	13037	23	610	0
177	15	13061	25	610	0
178	""	13092	27	610	0
179	""	13124	30	610	1
180	""	13173	32	611	0
181	""	13173	33	611	0
182	20	13173	32	611	0
183	""	13262	32	611	1
184	""	13302	35	611	0
185	""	13350	36	611	0
186	""	13390	38	612	0
187	25	13438	38	613	0
188	""	13438	38	613	1
189	""	13438	38	613	0
190	""	13547	41	613	0
191	""	13577	39	613	1
192	""	13634	41	614	0
193	""	13725	47	615	0
194	Aug	13789	51	615	1
195	""	13789	50	615	0
196	""	13789	50	615	0
197	""	13996	64	616	1
198	05	14073	71	616	0
199	""	14185	79	616	0
200	""	14306	83	617	1
201	""	14442	93	617	0
202	""	14442	93	617	0
203	10	14442	93	617	1
204	""	14815	117	620	0
205	""	14959	127	621	1
206	""	15070	126	621	1
207	""	15214	130	621	0
208	15	15379	134	621	1
209	""	15483	149	621	0
EOF

# confirmed:
set label "15483  " at first 209,154*625/175   left back textcolor "#8080ff"
# -~confirmed:
set label "149    " at first 209,149           left back textcolor "#ff8080"
set label "328    " at first  80,328        +7 left back textcolor "#ff8080"
# deaths:
set label "621    " at first 209,621           left back textcolor "#ff8080"
# -~deaths:
set label "0      " at first 209,  0*625/175   left back textcolor "#8080ff"
set label "17     " at first  79, 17*625/175+7 left back textcolor "#8080ff"

set multiplot
  plot $data using 0:($3/    100*625/175) with lines lc 6 lw 8 dt 1 title at 0.150, 0.920
replot $data using 0:($4/      1        ) with lines lc 7 lw 8 dt 4 title at 0.150, 0.902
replot $data using 0:($5/      1        ) with lines lc 7 lw 5 dt 2 title at 0.150, 0.884
replot $data using 0:($6/      1*625/175) with lines lc 6 lw 5 dt 3 title at 0.150, 0.866

# plot hor axis calendar
replot $data using 0:(0):xticlabel(2) with lines
|
File history
Click on a date/time to view the file as it appeared at that time.
| Date/Time | Thumbnail | Dimensions | User | Comment | |
|---|---|---|---|---|---|
| current | 19:00, 24 September 2020 |  | 3,300 × 1,950 (24 KB) | Jochen Burghardt (talk | contribs) | =={{int:filedesc}}== {{Information |description={{en|1=Diagram of WHO COVID-19 daily data (20 Jan - 16 Aug 2020) for ''"Total Confirmed Cases"'' (thick solid line), its smoothed increment (thick dash-dotted line), ''"Total Deaths"'' (thin dashed line), and its smoothed increment (thin dotted line); see File:WHO_Covid_2020_Jan-Aug_daily_C_Afghanistan.pdf for details.}} |date=2020-09-24 |source={{own}} |author=Jochen Burghardt |permission= |other_versions=[[:File:... |
You cannot overwrite this file.
File usage on Commons
There are no pages that use this file.