File:WHO Covid 2020 Jan-Aug daily C Ecuador.pdf
Jump to navigation
Jump to search

Size of this JPG preview of this PDF file: 800 × 473 pixels. Other resolutions: 320 × 189 pixels | 640 × 378 pixels | 1,024 × 605 pixels | 1,280 × 756 pixels | 3,300 × 1,950 pixels.
Original file (3,300 × 1,950 pixels, file size: 25 KB, MIME type: application/pdf)
Captions
Captions
Add a one-line explanation of what this file represents
Summary[edit]
| Description |
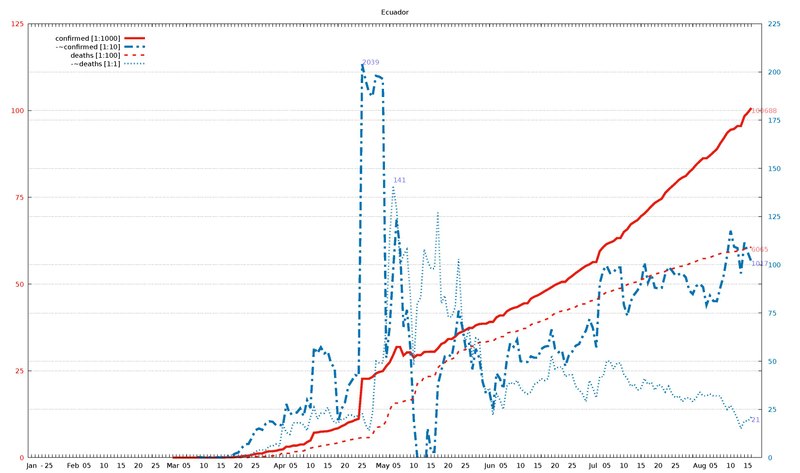
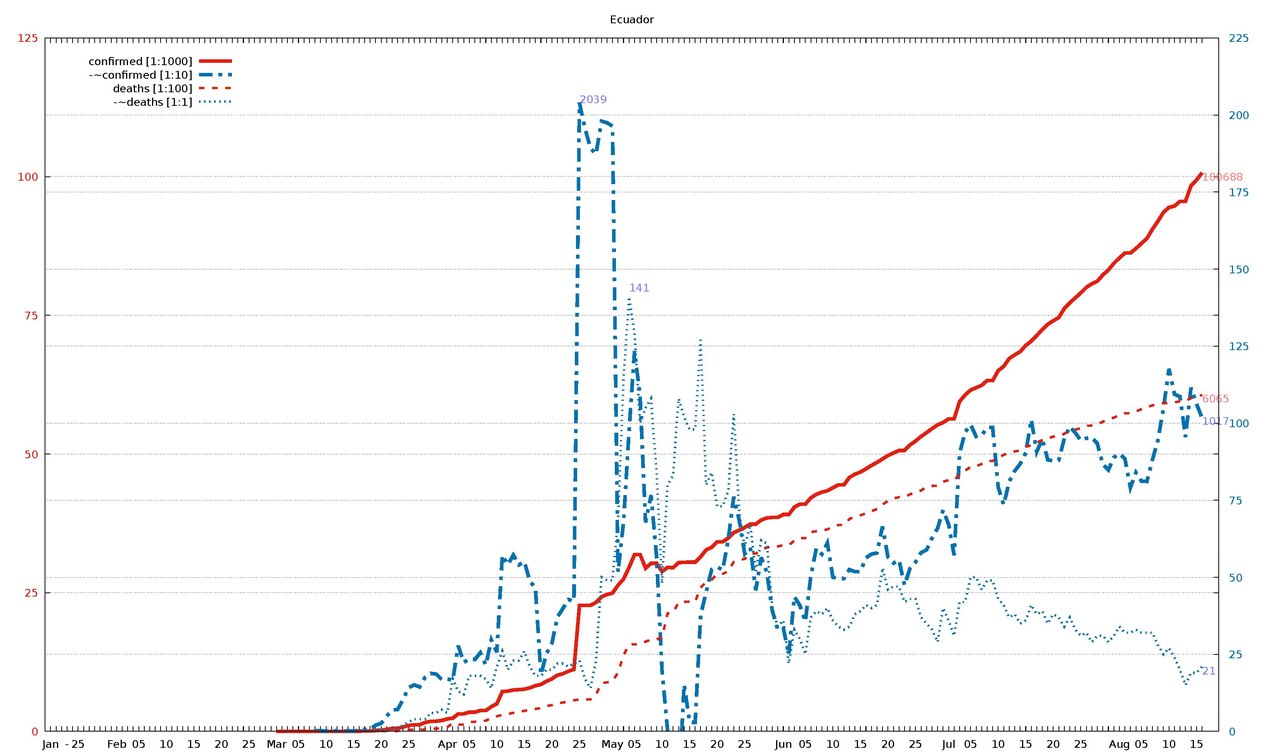
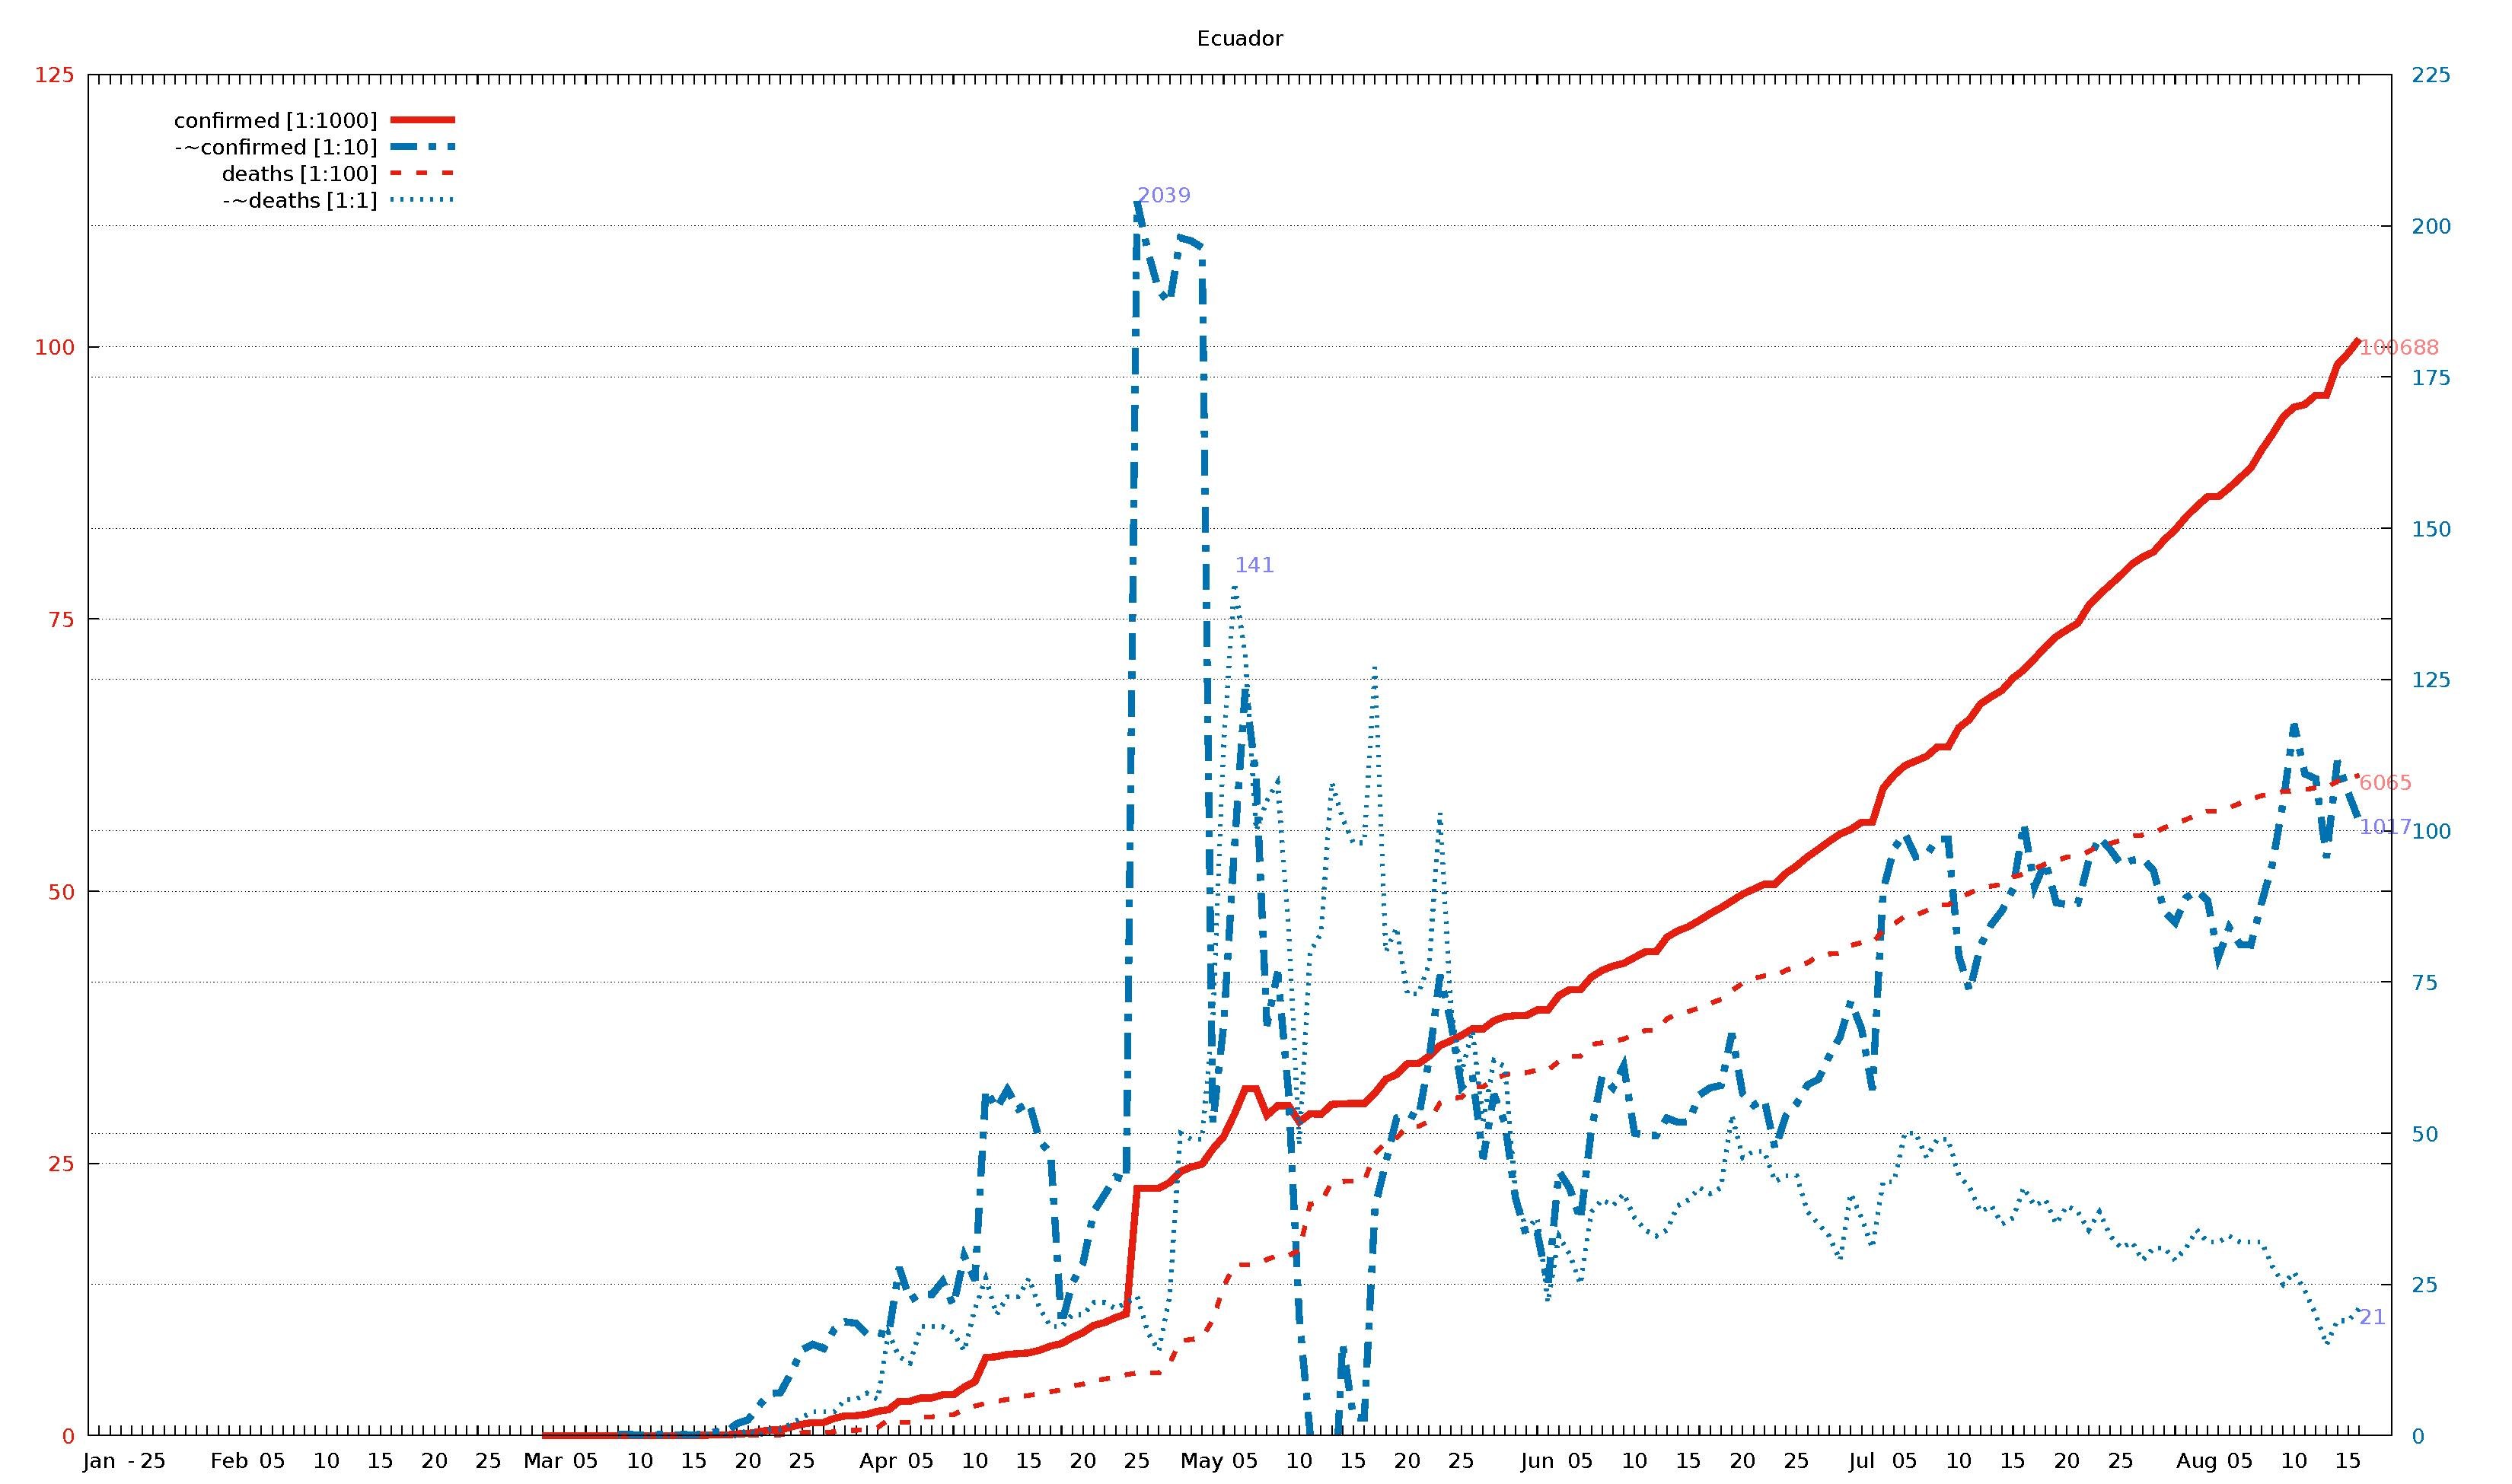
English: Diagram of WHO COVID-19 daily data (20 Jan - 16 Aug 2020) for "Total Confirmed Cases" (thick solid line), its smoothed increment (thick dash-dotted line), "Total Deaths" (thin dashed line) , and its smoothed increment (thin dotted line). Figures are taken from the available situation reports. Red and blue lines refer to the left and right vertical axis, respectively; the scaling factor for each curve is given in the legend. The horizontal axis starts on 20 Jan 2020 (situation report 1), and ends on 16 Aug 2020 (situation report 209). In the smoothed curves, for each day, 1/7 of the difference of the current day's figure and the figure a week ago is shown. For example, in situation report 115 (14 May 2020) and 121 (21 May 2020), there were 8676 and 5339 Total Confirmed Cases in Afghanistan, respectively, so the thick dash-dotted line passes through 477 = (8676-5339)/7 on 21 May.
For an overview of all related visualizations, and a more detailled description, see WHO Covid diagram set#Available country diagrams Jan-Aug 2020 (daily). |
| Date | |
| Source | Own work |
| Author | Jochen Burghardt |
Licensing[edit]
I, the copyright holder of this work, hereby publish it under the following license:
This file is licensed under the Creative Commons Attribution-Share Alike 4.0 International license.
- You are free:
- to share – to copy, distribute and transmit the work
- to remix – to adapt the work
- Under the following conditions:
- attribution – You must give appropriate credit, provide a link to the license, and indicate if changes were made. You may do so in any reasonable manner, but not in any way that suggests the licensor endorses you or your use.
- share alike – If you remix, transform, or build upon the material, you must distribute your contributions under the same or compatible license as the original.
Gnuplot source code[edit]
| Gnuplot source code |
|---|
set term pdf size 22,13
set term pdf font "sans,20"
set output "WHO_Covid_C_Ecuador.pdf"
set key autotitle columnhead
set termoption noenhanced
# (1) norm: 101 204 607 141
# (2) dist: 1,0:202 2,0:166 2,1:298 3,0:140 3,1:145 3,2:232
# (3,4) dist max: 298 2:607--1:204
# (4) right: 0 1 0 1
# (6,7) scMax: 125 225
# (8) scale: [1:1000] [1:10] [1:100] [1:1]


set xrange [-1:212]
set yrange [0:125]
set y2range [0:225]
set xtics 3650,100
set ytics 25 textcolor "#e51e10"
set y2tics 25 textcolor "#0072b2"
set grid y y2

set title "Ecuador"

$data <<EOF
rep day "confirmed [1:1000]" "-~confirmed [1:10]" "deaths [1:100]" "-~deaths [1:1]"
1	Jan	.	-	.	-
2	""	.	-	.	-
3	""	.	-	.	-
-	-	-	-	-	-
4	""	.	-	.	-
5	25	.	-	.	-
6	""	.	-	.	-
7	""	.	-	.	-
8	""	.	-	.	-
9	""	.	-	.	-
10	""	.	-	.	-
11	""	.	-	.	-
12	Feb	.	-	.	-
13	""	.	-	.	-
14	""	.	-	.	-
15	""	.	-	.	-
16	05	.	-	.	-
17	""	.	-	.	-
18	""	.	-	.	-
19	""	.	-	.	-
20	""	.	-	.	-
21	10	.	-	.	-
22	""	.	-	.	-
23	""	.	-	.	-
24	""	.	-	.	-
25	""	.	-	.	-
26	15	.	-	.	-
27	""	.	-	.	-
28	""	.	-	.	-
29	""	.	-	.	-
30	""	.	-	.	-
31	20	.	-	.	-
32	""	.	-	.	-
33	""	.	-	.	-
34	""	.	-	.	-
35	""	.	-	.	-
36	25	.	-	.	-
37	""	.	-	.	-
38	""	.	-	.	-
39	""	.	-	.	-
40	""	.	-	.	-
41	Mar	1	-	0	-
42	""	1	-	0	-
43	""	6	-	0	-
44	""	7	-	0	-
45	05	7	-	0	-
46	""	13	-	0	-
47	""	14	-	0	-
48	""	14	2	0	0
49	""	15	2	0	0
50	10	15	1	0	0
51	""	15	1	0	0
52	""	17	2	0	0
53	""	17	0	0	0
54	""	23	2	0	0
55	15	23	1	0	0
56	""	37	3	2	0
57	""	58	6	2	1
58	""	58	6	2	0
59	""	155	20	2	0
60	20	199	26	3	1
61	""	367	49	5	0
62	""	506	69	7	1
63	""	532	71	7	1
64	""	790	104	15	2
65	25	1049	142	27	3
66	""	1211	151	29	4
67	""	1211	144	29	4
68	""	1595	176	36	4
69	""	1823	188	48	6
70	""	1835	186	48	6
71	""	1962	168	60	7
72	Apr	2240	170	75	6
73	""	2372	166	146	17
74	""	3163	278	120	13
75	""	3163	224	120	12
76	05	3465	235	172	18
77	""	3465	233	172	18
78	""	3747	255	191	18
79	""	3747	215	191	17
80	""	4450	297	242	14
81	10	4965	257	272	21
82	""	7161	572	297	26
83	""	7257	541	315	20
84	""	7466	572	333	23
85	""	7529	540	355	23
86	15	7603	551	369	26
87	""	7858	487	388	21
88	""	8225	466	403	18
89	""	8450	184	421	18
90	""	9022	252	456	20
91	20	9468	286	474	20
92	""	10128	371	507	22
93	""	10398	399	520	22
94	""	10850	428	537	21
95	""	11183	422	560	22
96	25	22719	2039	576	23
97	""	22719	1957	576	17
98	""	22719	1893	576	14
99	""	23240	1873	663	23
100	""	24258	1980	871	50
101	""	24675	1975	883	49
102	May	24934	1964	900	49
103	""	26336	517	1063	69
104	""	27464	678	1371	114
105	""	29538	974	1564	141
106	05	31881	1234	1569	129
107	""	31881	1089	1569	100
108	""	29420	678	1618	105
109	""	30298	766	1654	108
110	""	30298	566	1654	84
111	10	28818	194	1704	48
112	""	29559	3	2127	80
113	""	29509	-339	2145	83
114	""	30419	-209	2327	108
115	""	30486	152	2334	102
116	15	30502	30	2338	98
117	""	30502	29	2338	98
118	""	31467	378	2594	127
119	""	32723	452	2688	80
120	""	33182	525	2736	84
121	20	34151	533	2839	73
122	""	34151	524	2839	73
123	""	34854	621	2888	78
124	""	35828	761	3056	103
125	""	36258	685	3096	71
126	25	36756	576	3108	60
127	""	37355	596	3203	67
128	""	37355	458	3203	52
129	""	38103	564	3275	62
130	""	38471	517	3313	61
131	""	38571	392	3334	40
132	""	38571	330	3334	34
133	Jun	39098	335	3358	36
134	""	39098	249	3358	22
135	""	40414	437	3438	33
136	""	40966	409	3486	30
137	05	40966	356	3486	25
138	""	42106	505	3592	37
139	""	42728	594	3608	39
140	""	43120	575	3621	38
141	""	43378	611	3642	40
142	10	43917	500	3690	36
143	""	44440	497	3720	34
144	""	44440	496	3720	33
145	""	45778	525	3828	34
146	""	46356	518	3874	38
147	15	46751	519	3896	39
148	""	47322	563	3929	41
149	""	47943	575	3970	40
150	""	48490	579	4007	41
151	""	49097	665	4087	53
152	20	49731	565	4156	46
153	""	50183	546	4199	47
154	""	50640	556	4223	47
155	""	50640	474	4223	42
156	""	51643	529	4274	43
157	25	52334	549	4309	43
158	""	53156	580	4343	37
159	""	53856	589	4406	35
160	""	54574	627	4424	33
161	""	55255	659	4429	29
162	""	55665	718	4502	40
163	Jul	56342	672	4527	36
164	""	56342	572	4527	31
165	""	59468	902	4639	42
166	""	60657	971	4700	42
167	05	61535	995	4769	50
168	""	61958	957	4781	50
169	""	62380	960	4821	46
170	""	63245	986	4873	49
171	""	63245	986	4873	49
172	10	65018	793	4939	43
173	""	65801	735	4983	41
174	""	67209	810	5031	37
175	""	67870	845	5047	38
176	""	68459	868	5063	35
177	15	69570	904	5130	36
178	""	70329	1012	5158	41
179	""	71365	907	5207	38
180	""	72444	949	5250	39
181	""	73382	881	5282	35
182	20	74013	878	5313	38
183	""	74620	880	5318	37
184	""	76217	950	5366	34
185	""	77257	989	5418	37
186	""	78148	969	5439	33
187	25	79049	944	5468	31
188	""	80036	951	5507	32
189	""	80694	954	5515	29
190	""	81161	934	5532	31
191	""	82279	866	5584	31
192	""	83193	848	5623	29
193	""	84370	889	5657	31
194	Aug	85355	901	5702	34
195	""	86232	885	5736	32
196	""	86232	791	5736	32
197	""	87041	840	5767	33
198	05	87963	812	5808	32
199	""	88866	811	5847	32
200	""	90537	881	5877	32
201	""	91969	945	5897	28
202	""	93572	1048	5916	25
203	10	94459	1176	5922	27
204	""	94701	1094	5932	24
205	""	95563	1086	5951	20
206	""	95563	956	5951	15
207	""	98343	1115	6010	19
208	15	99409	1063	6030	19
209	""	100688	1017	6065	21
EOF

# confirmed:
set label "100688 " at first 209,100           left back textcolor "#ff8080"
# -~confirmed:
set label "1017   " at first 209,101*125/225   left back textcolor "#8080ff"
set label "2039   " at first  96,203*125/225+2 left back textcolor "#8080ff"
# deaths:
set label "6065   " at first 209, 60           left back textcolor "#ff8080"
# -~deaths:
set label "21     " at first 209, 21*125/225   left back textcolor "#8080ff"
set label "141    " at first 105,141*125/225+2 left back textcolor "#8080ff"

set multiplot
  plot $data using 0:($3/   1000        ) with lines lc 7 lw 8 dt 1 title at 0.150, 0.920
replot $data using 0:($4/     10*125/225) with lines lc 6 lw 8 dt 4 title at 0.150, 0.902
replot $data using 0:($5/    100        ) with lines lc 7 lw 5 dt 2 title at 0.150, 0.884
replot $data using 0:($6/      1*125/225) with lines lc 6 lw 5 dt 3 title at 0.150, 0.866

# plot hor axis calendar
replot $data using 0:(0):xticlabel(2) with lines
|
File history
Click on a date/time to view the file as it appeared at that time.
| Date/Time | Thumbnail | Dimensions | User | Comment | |
|---|---|---|---|---|---|
| current | 19:01, 24 September 2020 |  | 3,300 × 1,950 (25 KB) | Jochen Burghardt (talk | contribs) | =={{int:filedesc}}== {{Information |description={{en|1=Diagram of WHO COVID-19 daily data (20 Jan - 16 Aug 2020) for ''"Total Confirmed Cases"'' (thick solid line), its smoothed increment (thick dash-dotted line), ''"Total Deaths"'' (thin dashed line), and its smoothed increment (thin dotted line); see File:WHO_Covid_2020_Jan-Aug_daily_C_Afghanistan.pdf for details.}} |date=2020-09-24 |source={{own}} |author=Jochen Burghardt |permission= |other_versions=[[:File:... |
You cannot overwrite this file.
File usage on Commons
There are no pages that use this file.