File:WHO Covid 2020 Jan-Aug daily C Finland.pdf
Jump to navigation
Jump to search

Size of this JPG preview of this PDF file: 800 × 473 pixels. Other resolutions: 320 × 189 pixels | 640 × 378 pixels | 1,024 × 605 pixels | 1,280 × 756 pixels | 3,300 × 1,950 pixels.
Original file (3,300 × 1,950 pixels, file size: 23 KB, MIME type: application/pdf)
Captions
Captions
Add a one-line explanation of what this file represents
Summary[edit]
| Description |
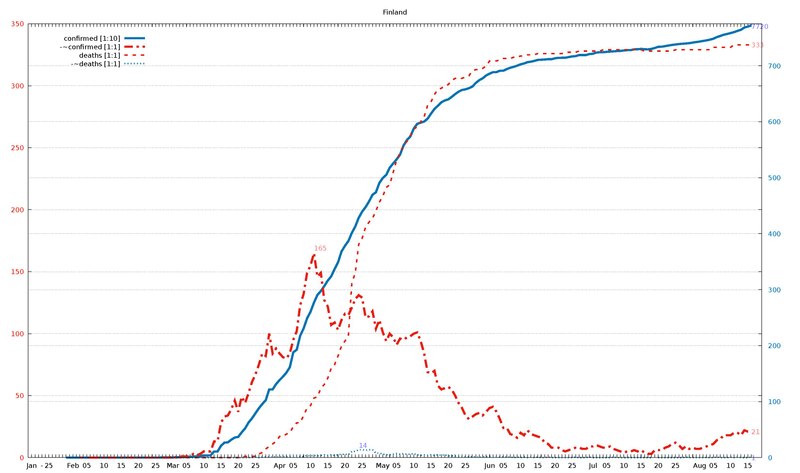
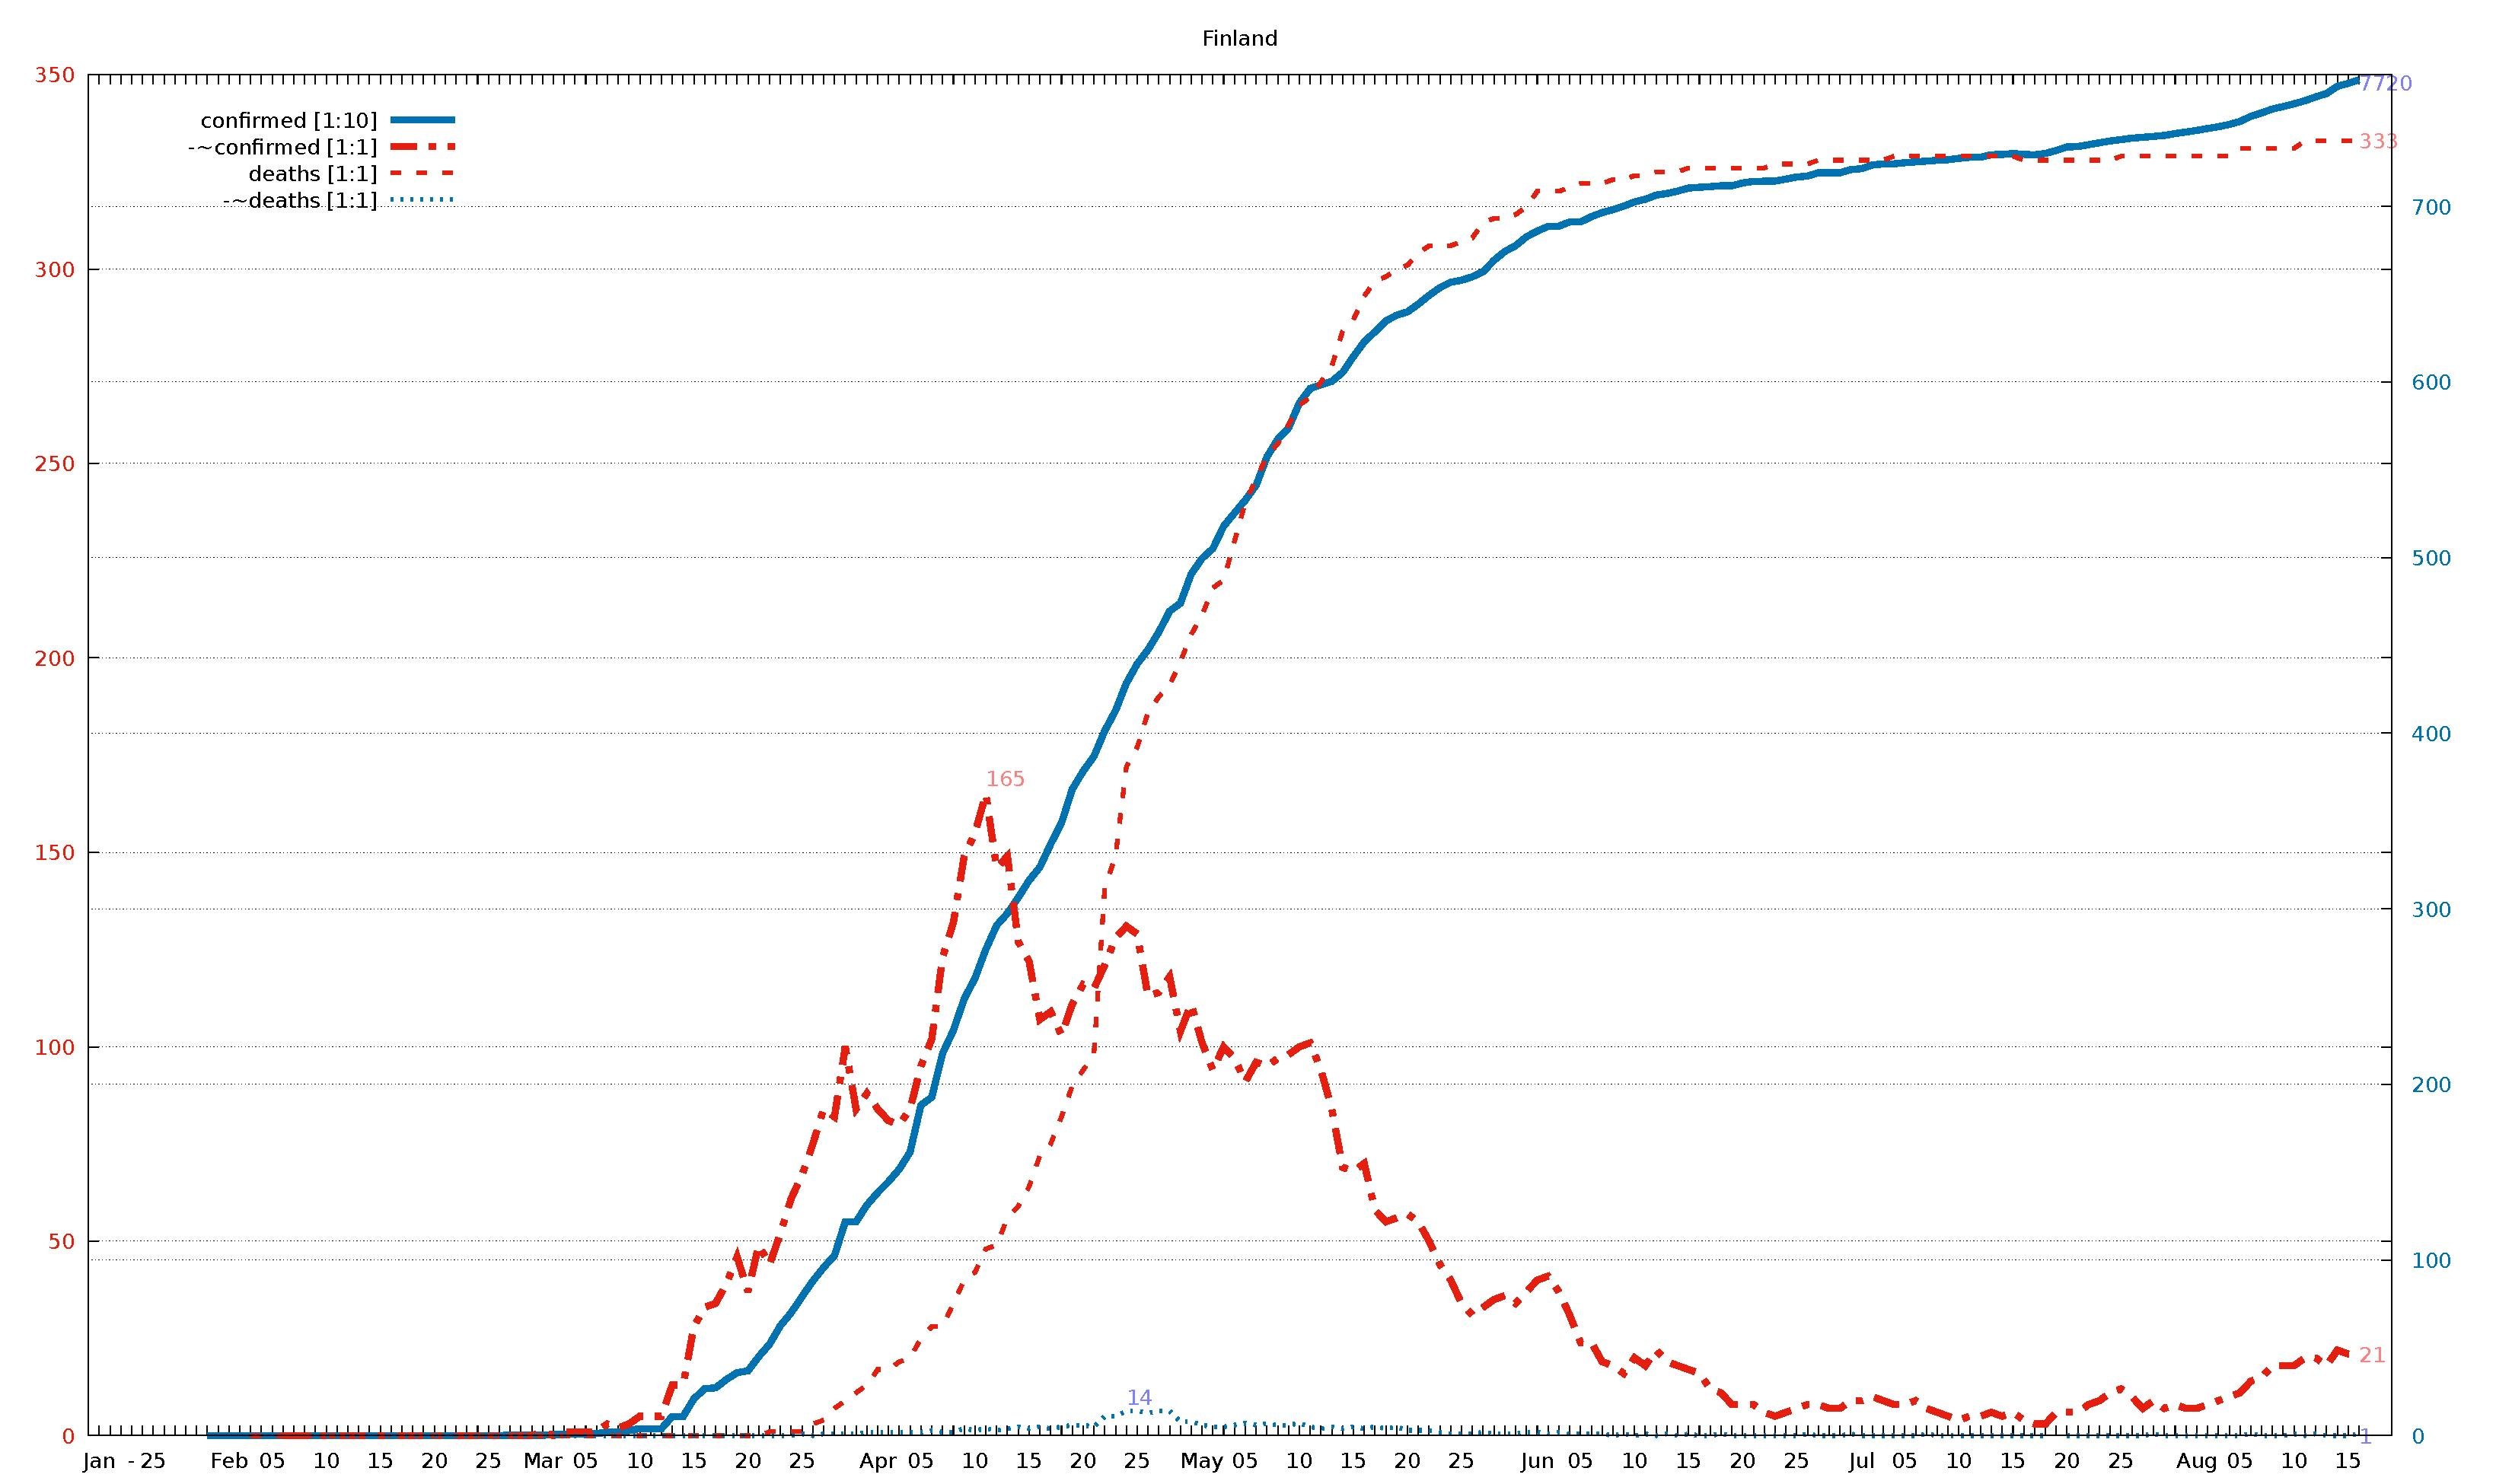
English: Diagram of WHO COVID-19 daily data (20 Jan - 16 Aug 2020) for "Total Confirmed Cases" (thick solid line), its smoothed increment (thick dash-dotted line), "Total Deaths" (thin dashed line) , and its smoothed increment (thin dotted line). Figures are taken from the available situation reports. Red and blue lines refer to the left and right vertical axis, respectively; the scaling factor for each curve is given in the legend. The horizontal axis starts on 20 Jan 2020 (situation report 1), and ends on 16 Aug 2020 (situation report 209). In the smoothed curves, for each day, 1/7 of the difference of the current day's figure and the figure a week ago is shown. For example, in situation report 115 (14 May 2020) and 121 (21 May 2020), there were 8676 and 5339 Total Confirmed Cases in Afghanistan, respectively, so the thick dash-dotted line passes through 477 = (8676-5339)/7 on 21 May.
For an overview of all related visualizations, and a more detailled description, see WHO Covid diagram set#Available country diagrams Jan-Aug 2020 (daily). |
| Date | |
| Source | Own work |
| Author | Jochen Burghardt |
Licensing[edit]
I, the copyright holder of this work, hereby publish it under the following license:
This file is licensed under the Creative Commons Attribution-Share Alike 4.0 International license.
- You are free:
- to share – to copy, distribute and transmit the work
- to remix – to adapt the work
- Under the following conditions:
- attribution – You must give appropriate credit, provide a link to the license, and indicate if changes were made. You may do so in any reasonable manner, but not in any way that suggests the licensor endorses you or your use.
- share alike – If you remix, transform, or build upon the material, you must distribute your contributions under the same or compatible license as the original.
Gnuplot source code[edit]
| Gnuplot source code |
|---|
set term pdf size 22,13
set term pdf font "sans,20"
set output "WHO_Covid_C_Finland.pdf"
set key autotitle columnhead
set termoption noenhanced
# (1) norm: 772 165 333 001
# (2) dist: 1,0:213 2,0:232 2,1:202
# (3,4) dist max: 232 2:333--0:772
# (4) right: 1 0 0 1
# (6,7) scMax: 350 775
# (8) scale: [1:10] [1:1] [1:1] [1:1]


set xrange [-1:212]
set yrange [0:350]
set y2range [0:775]
set xtics 3650,100
set ytics 50 textcolor "#e51e10"
set y2tics 100 textcolor "#0072b2"
set grid y y2

set title "Finland"

$data <<EOF
rep day "confirmed [1:10]" "-~confirmed [1:1]" "deaths [1:1]" "-~deaths [1:1]"
1	Jan	.	-	.	-
2	""	.	-	.	-
3	""	.	-	.	-
-	-	-	-	-	-
4	""	.	-	.	-
5	25	.	-	.	-
6	""	.	-	.	-
7	""	.	-	.	-
8	""	.	-	.	-
9	""	.	-	.	-
10	""	1	-	.	-
11	""	1	-	.	-
12	Feb	1	-	.	-
13	""	1	-	.	-
14	""	1	-	0	-
15	""	1	-	0	-
16	05	1	-	0	-
17	""	1	0	0	-
18	""	1	0	0	-
19	""	1	0	0	-
20	""	1	0	0	-
21	10	1	0	0	0
22	""	1	0	0	0
23	""	1	0	0	0
24	""	1	0	0	0
25	""	1	0	0	0
26	15	1	0	0	0
27	""	1	0	0	0
28	""	1	0	0	0
29	""	1	0	0	0
30	""	1	0	0	0
31	20	1	0	0	0
32	""	1	0	0	0
33	""	1	0	0	0
34	""	1	0	0	0
35	""	1	0	0	0
36	25	1	0	0	0
37	""	1	0	0	0
38	""	2	0	0	0
39	""	2	0	0	0
40	""	2	0	0	0
41	Mar	2	1	0	0
42	""	6	0	0	0
43	""	7	1	0	0
44	""	7	1	0	0
45	05	7	1	0	0
46	""	12	1	0	0
47	""	19	3	0	0
48	""	19	2	0	0
49	""	30	3	0	0
50	10	40	5	0	0
51	""	40	5	0	0
52	""	40	5	0	0
53	""	109	13	0	0
54	""	109	13	0	0
55	15	210	28	0	0
56	""	267	33	0	0
57	""	272	34	0	0
58	""	319	39	0	0
59	""	359	46	0	0
60	20	369	37	0	0
61	""	450	49	0	0
62	""	521	44	1	0
63	""	626	52	1	0
64	""	700	61	1	0
65	25	792	67	1	1
66	""	880	75	3	0
67	""	958	84	4	1
68	""	1025	82	7	1
69	""	1218	100	9	1
70	""	1218	84	11	1
71	""	1313	88	13	2
72	Apr	1384	84	17	2
73	""	1446	81	17	2
74	""	1518	80	19	2
75	""	1615	84	20	2
76	05	1882	95	25	2
77	""	1927	102	28	3
78	""	2176	123	28	2
79	""	2308	132	34	2
80	""	2487	149	40	4
81	10	2605	155	42	3
82	""	2769	165	48	4
83	""	2905	146	49	3
84	""	2974	149	56	4
85	""	3064	127	59	5
86	15	3161	122	64	4
87	""	3237	107	72	5
88	""	3369	109	75	4
89	""	3489	103	82	5
90	""	3681	111	90	6
91	20	3783	116	94	6
92	""	3868	115	98	5
93	""	4014	121	141	11
94	""	4129	128	149	11
95	""	4284	131	172	14
96	25	4395	129	177	14
97	""	4475	113	186	13
98	""	4576	114	190	14
99	""	4695	118	193	14
100	""	4740	104	199	8
101	""	4906	111	206	8
102	May	4995	101	211	6
103	""	5051	94	218	5
104	""	5179	100	220	5
105	""	5254	97	230	6
106	05	5327	91	240	7
107	""	5412	96	246	6
108	""	5573	95	252	7
109	""	5673	97	255	6
110	""	5738	98	260	6
111	10	5880	100	265	7
112	""	5962	101	267	5
113	""	5984	94	271	4
114	""	6003	84	275	5
115	""	6054	69	284	4
116	15	6145	68	287	5
117	""	6228	70	293	4
118	""	6286	58	297	5
119	""	6347	55	298	4
120	""	6380	56	300	5
121	20	6399	57	301	3
122	""	6443	55	304	3
123	""	6493	50	306	3
124	""	6537	44	306	2
125	""	6568	40	306	1
126	25	6579	34	307	1
127	""	6599	31	308	1
128	""	6628	33	312	2
129	""	6692	35	313	1
130	""	6743	36	313	1
131	""	6776	34	314	1
132	""	6826	37	316	2
133	Jun	6859	40	320	2
134	""	6885	41	320	1
135	""	6887	37	320	2
136	""	6911	31	321	1
137	05	6911	24	322	1
138	""	6941	24	322	1
139	""	6964	19	322	1
140	""	6981	18	323	0
141	""	7001	16	323	1
142	10	7025	20	324	0
143	""	7040	18	324	1
144	""	7064	22	325	0
145	""	7073	19	325	1
146	""	7087	18	325	0
147	15	7104	17	326	1
148	""	7108	16	326	0
149	""	7112	12	326	0
150	""	7117	11	326	1
151	""	7117	8	326	0
152	20	7133	8	326	0
153	""	7142	8	326	0
154	""	7143	6	326	0
155	""	7144	5	327	0
156	""	7155	6	327	0
157	25	7167	7	327	0
158	""	7172	8	327	1
159	""	7191	8	328	0
160	""	7191	7	328	0
161	""	7191	7	328	0
162	""	7209	9	328	1
163	Jul	7214	9	328	0
164	""	7236	10	328	0
165	""	7241	9	328	0
166	""	7242	8	329	0
167	05	7248	8	329	0
168	""	7253	9	329	0
169	""	7257	7	329	1
170	""	7262	6	329	0
171	""	7265	5	329	0
172	10	7273	4	329	0
173	""	7279	5	329	0
174	""	7279	5	329	0
175	""	7294	6	329	0
176	""	7295	5	329	0
177	15	7301	6	329	0
178	""	7296	4	328	0
179	""	7293	3	328	0
180	""	7301	3	328	0
181	""	7318	6	328	-1
182	20	7338	6	328	0
183	""	7340	6	328	0
184	""	7351	8	328	0
185	""	7362	9	328	0
186	""	7372	11	328	0
187	25	7380	12	329	0
188	""	7388	10	329	0
189	""	7393	7	329	0
190	""	7398	9	329	1
191	""	7404	7	329	0
192	""	7414	8	329	0
193	""	7423	7	329	0
194	Aug	7432	7	329	0
195	""	7443	8	329	0
196	""	7453	9	329	0
197	""	7466	10	329	0
198	05	7483	11	331	0
199	""	7512	14	331	1
200	""	7532	15	331	0
201	""	7554	18	331	0
202	""	7568	18	331	0
203	10	7584	18	331	1
204	""	7601	20	333	0
205	""	7623	20	333	1
206	""	7642	18	333	0
207	""	7683	22	333	0
208	15	7700	21	333	0
209	""	7720	21	333	1
EOF

# confirmed:
set label "7720   " at first 209,772*350/775   left back textcolor "#8080ff"
# -~confirmed:
set label "21     " at first 209, 21           left back textcolor "#ff8080"
set label "165    " at first  82,165        +4 left back textcolor "#ff8080"
# deaths:
set label "333    " at first 209,333           left back textcolor "#ff8080"
# -~deaths:
set label "1      " at first 209,  1*350/775   left back textcolor "#8080ff"
set label "14     " at first  95, 14*350/775+4 left back textcolor "#8080ff"

set multiplot
  plot $data using 0:($3/     10*350/775) with lines lc 6 lw 8 dt 1 title at 0.150, 0.920
replot $data using 0:($4/      1        ) with lines lc 7 lw 8 dt 4 title at 0.150, 0.902
replot $data using 0:($5/      1        ) with lines lc 7 lw 5 dt 2 title at 0.150, 0.884
replot $data using 0:($6/      1*350/775) with lines lc 6 lw 5 dt 3 title at 0.150, 0.866

# plot hor axis calendar
replot $data using 0:(0):xticlabel(2) with lines
|
File history
Click on a date/time to view the file as it appeared at that time.
| Date/Time | Thumbnail | Dimensions | User | Comment | |
|---|---|---|---|---|---|
| current | 19:05, 24 September 2020 |  | 3,300 × 1,950 (23 KB) | Jochen Burghardt (talk | contribs) | =={{int:filedesc}}== {{Information |description={{en|1=Diagram of WHO COVID-19 daily data (20 Jan - 16 Aug 2020) for ''"Total Confirmed Cases"'' (thick solid line), its smoothed increment (thick dash-dotted line), ''"Total Deaths"'' (thin dashed line), and its smoothed increment (thin dotted line); see File:WHO_Covid_2020_Jan-Aug_daily_C_Afghanistan.pdf for details.}} |date=2020-09-24 |source={{own}} |author=Jochen Burghardt |permission= |other_versions=[[:File:... |
You cannot overwrite this file.
File usage on Commons
There are no pages that use this file.