File:WHO Covid 2020 Jan-Aug daily C Guinea.pdf
Jump to navigation
Jump to search

Size of this JPG preview of this PDF file: 800 × 473 pixels. Other resolutions: 320 × 189 pixels | 640 × 378 pixels | 1,024 × 605 pixels | 1,280 × 756 pixels | 3,300 × 1,950 pixels.
Original file (3,300 × 1,950 pixels, file size: 22 KB, MIME type: application/pdf)
Captions
Captions
Add a one-line explanation of what this file represents
Summary[edit]
| Description |
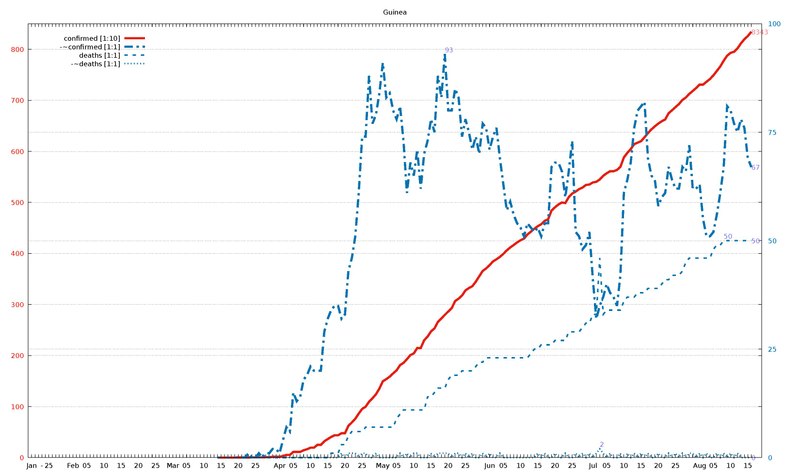
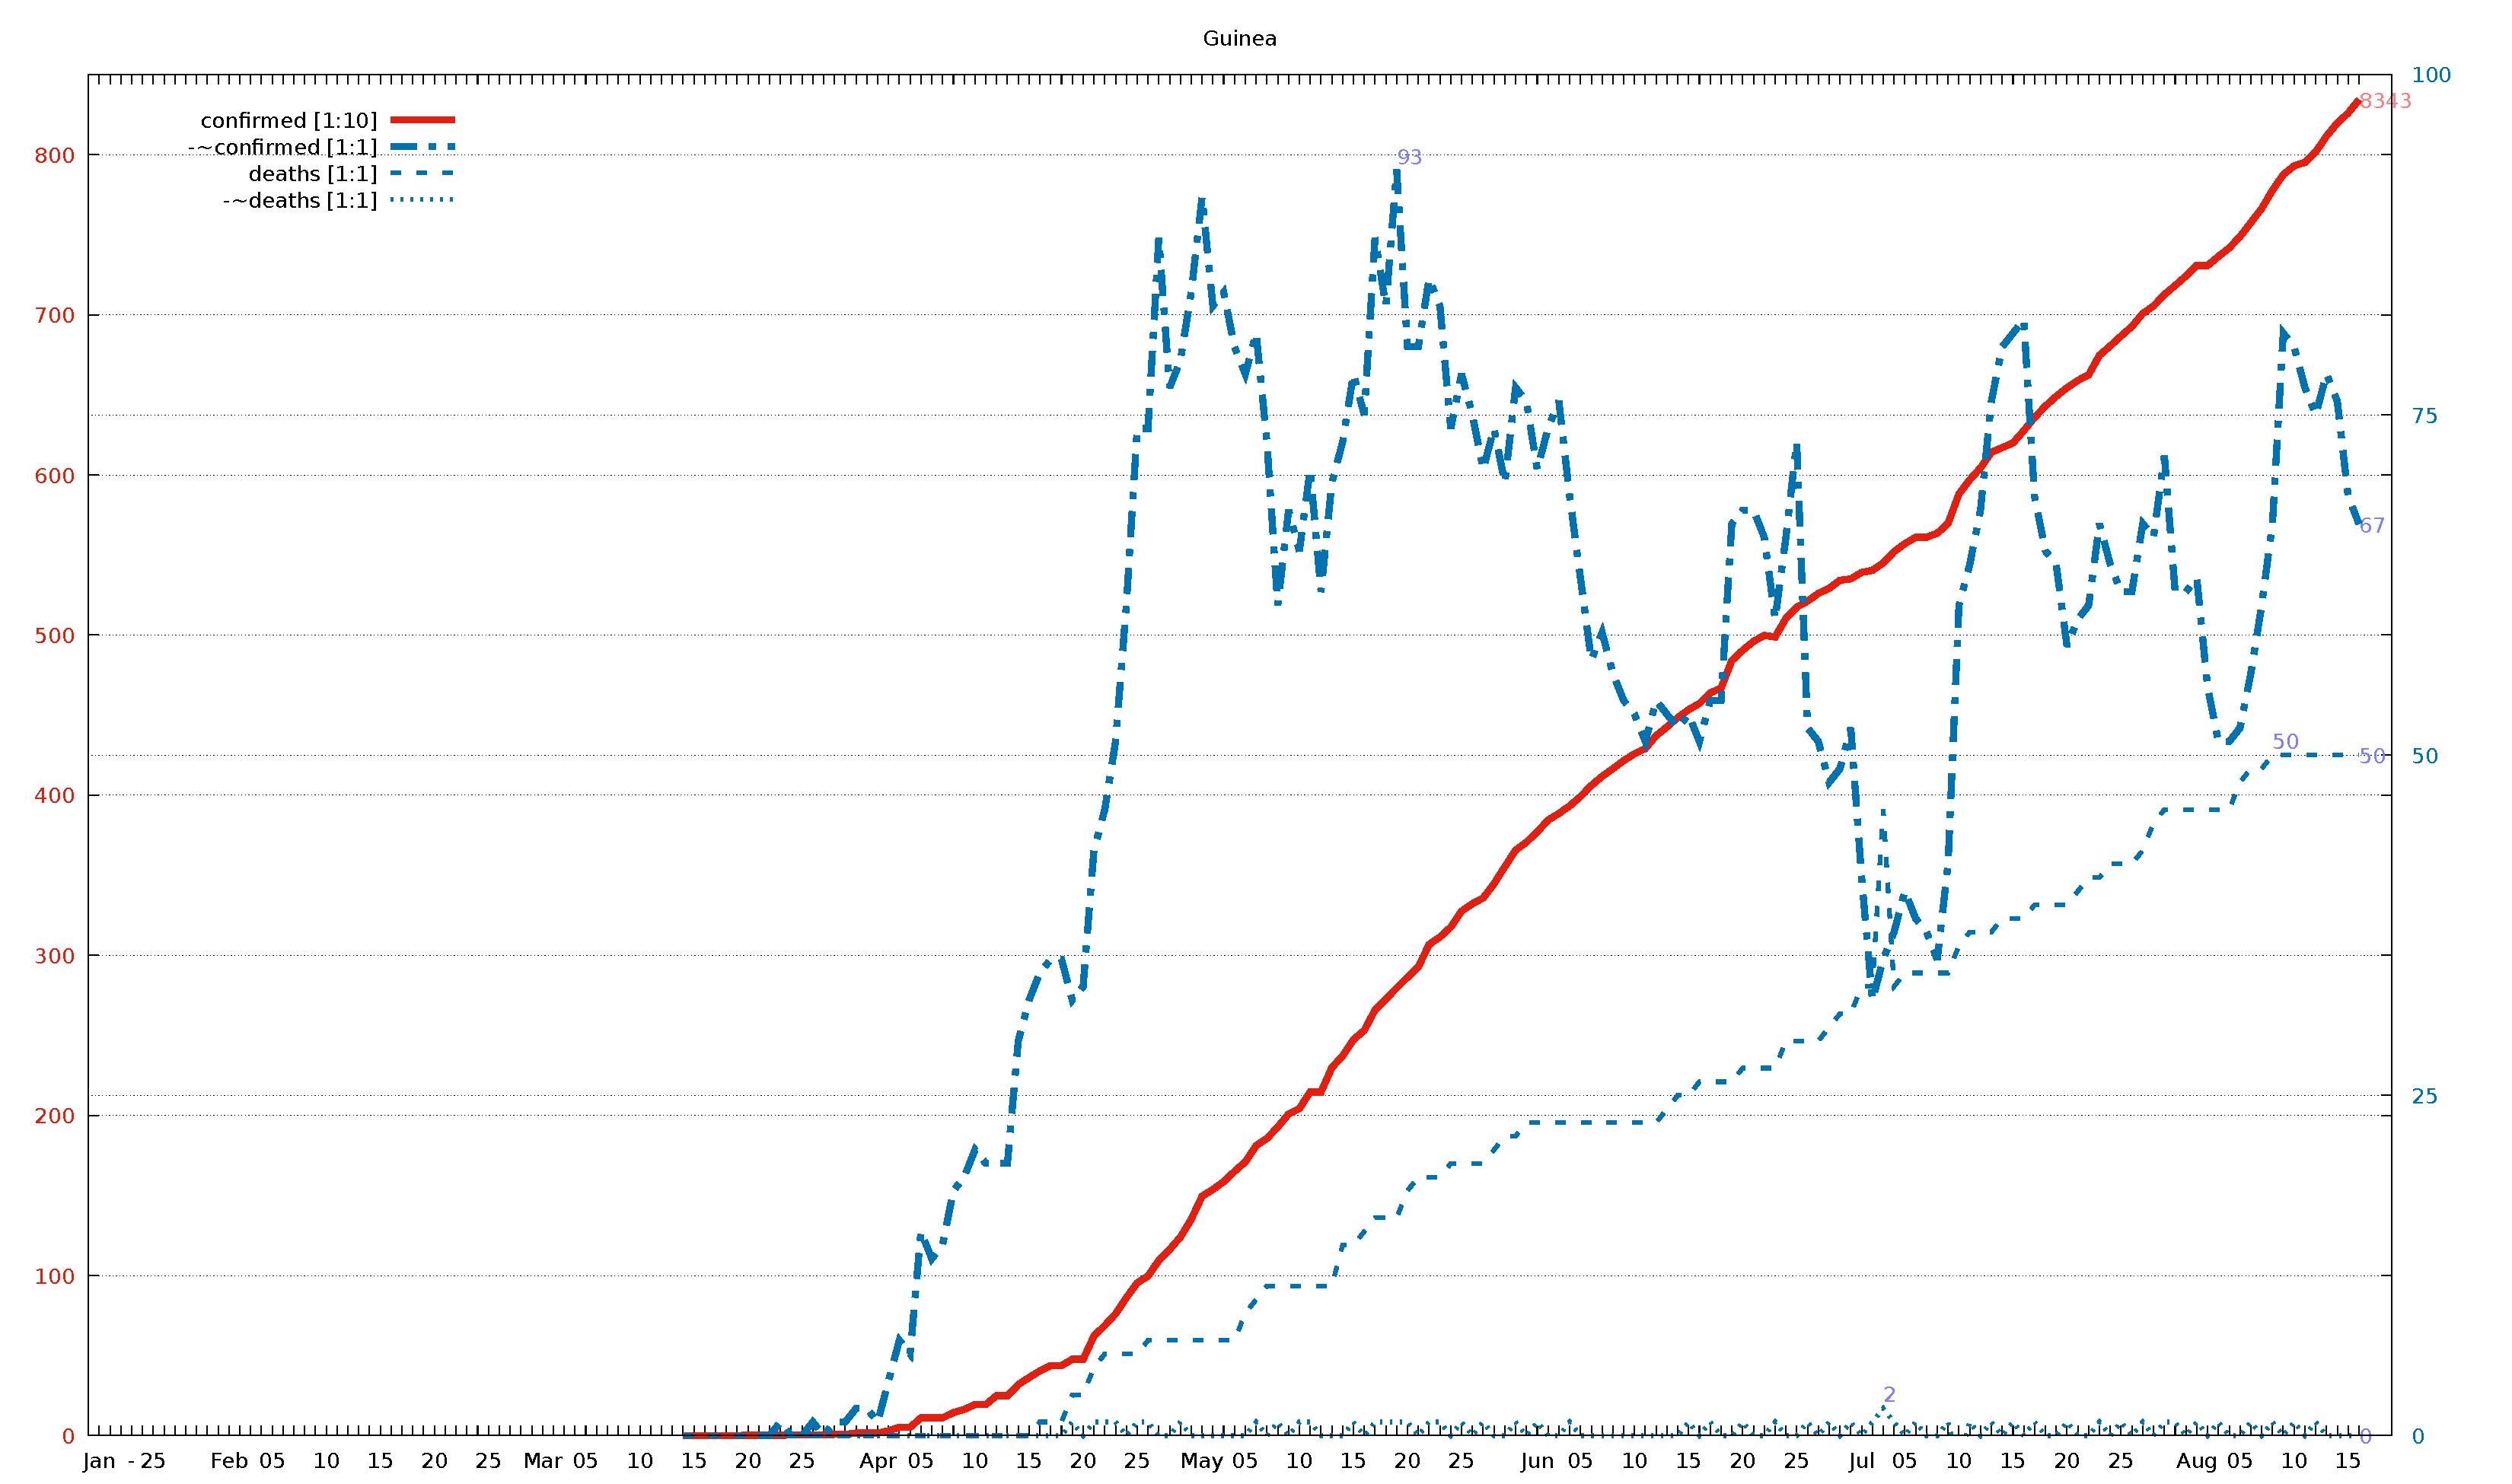
English: Diagram of WHO COVID-19 daily data (20 Jan - 16 Aug 2020) for "Total Confirmed Cases" (thick solid line), its smoothed increment (thick dash-dotted line), "Total Deaths" (thin dashed line) , and its smoothed increment (thin dotted line). Figures are taken from the available situation reports. Red and blue lines refer to the left and right vertical axis, respectively; the scaling factor for each curve is given in the legend. The horizontal axis starts on 20 Jan 2020 (situation report 1), and ends on 16 Aug 2020 (situation report 209). In the smoothed curves, for each day, 1/7 of the difference of the current day's figure and the figure a week ago is shown. For example, in situation report 115 (14 May 2020) and 121 (21 May 2020), there were 8676 and 5339 Total Confirmed Cases in Afghanistan, respectively, so the thick dash-dotted line passes through 477 = (8676-5339)/7 on 21 May.
For an overview of all related visualizations, and a more detailled description, see WHO Covid diagram set#Available country diagrams Jan-Aug 2020 (daily). |
| Date | |
| Source | Own work |
| Author | Jochen Burghardt |
Licensing[edit]
I, the copyright holder of this work, hereby publish it under the following license:
This file is licensed under the Creative Commons Attribution-Share Alike 4.0 International license.
- You are free:
- to share – to copy, distribute and transmit the work
- to remix – to adapt the work
- Under the following conditions:
- attribution – You must give appropriate credit, provide a link to the license, and indicate if changes were made. You may do so in any reasonable manner, but not in any way that suggests the licensor endorses you or your use.
- share alike – If you remix, transform, or build upon the material, you must distribute your contributions under the same or compatible license as the original.
Gnuplot source code[edit]
| Gnuplot source code |
|---|
set term pdf size 22,13
set term pdf font "sans,20"
set output "WHO_Covid_C_Guinea.pdf"
set key autotitle columnhead
set termoption noenhanced
# (1) norm: 835 001 001 001

set xrange [-1:212]
set yrange [0:850]
set y2range [0:100]
set xtics 3650,100
set ytics 100 textcolor "#e51e10"
set y2tics 25 textcolor "#0072b2"
set grid y y2

set title "Guinea"

$data <<EOF
rep day "confirmed [1:10]" "-~confirmed [1:1]" "deaths [1:1]" "-~deaths [1:1]"
1	Jan	.	-	.	-
2	""	.	-	.	-
3	""	.	-	.	-
-	-	-	-	-	-
4	""	.	-	.	-
5	25	.	-	.	-
6	""	.	-	.	-
7	""	.	-	.	-
8	""	.	-	.	-
9	""	.	-	.	-
10	""	.	-	.	-
11	""	.	-	.	-
12	Feb	.	-	.	-
13	""	.	-	.	-
14	""	.	-	.	-
15	""	.	-	.	-
16	05	.	-	.	-
17	""	.	-	.	-
18	""	.	-	.	-
19	""	.	-	.	-
20	""	.	-	.	-
21	10	.	-	.	-
22	""	.	-	.	-
23	""	.	-	.	-
24	""	.	-	.	-
25	""	.	-	.	-
26	15	.	-	.	-
27	""	.	-	.	-
28	""	.	-	.	-
29	""	.	-	.	-
30	""	.	-	.	-
31	20	.	-	.	-
32	""	.	-	.	-
33	""	.	-	.	-
34	""	.	-	.	-
35	""	.	-	.	-
36	25	.	-	.	-
37	""	.	-	.	-
38	""	.	-	.	-
39	""	.	-	.	-
40	""	.	-	.	-
41	Mar	.	-	.	-
42	""	.	-	.	-
43	""	.	-	.	-
44	""	.	-	.	-
45	05	.	-	.	-
46	""	.	-	.	-
47	""	.	-	.	-
48	""	.	-	.	-
49	""	.	-	.	-
50	10	.	-	.	-
51	""	.	-	.	-
52	""	.	-	.	-
53	""	.	-	.	-
54	""	1	-	0	-
55	15	1	-	0	-
56	""	1	-	0	-
57	""	1	-	0	-
58	""	1	-	0	-
59	""	1	-	0	-
60	20	2	-	0	-
61	""	2	0	0	0
62	""	2	0	0	0
63	""	2	1	0	0
64	""	4	0	0	0
65	25	4	0	0	0
66	""	4	1	0	0
67	""	5	0	0	0
68	""	8	1	0	0
69	""	8	1	0	0
70	""	16	2	0	0
71	""	16	2	0	0
72	Apr	16	1	0	0
73	""	30	4	0	0
74	""	52	7	0	0
75	""	52	6	0	0
76	05	111	15	0	0
77	""	111	13	0	0
78	""	111	14	0	0
79	""	144	18	0	0
80	""	164	19	0	0
81	10	194	21	0	0
82	""	194	20	0	0
83	""	250	20	0	0
84	""	250	20	0	0
85	""	319	29	0	0
86	15	363	32	0	0
87	""	404	34	1	0
88	""	438	35	1	0
89	""	438	35	1	0
90	""	477	32	3	1
91	20	477	33	3	0
92	""	622	43	5	1
93	""	688	46	6	1
94	""	761	51	6	1
95	""	862	61	6	0
96	25	954	74	6	1
97	""	996	74	7	1
98	""	1094	88	7	0
99	""	1163	77	7	0
100	""	1240	79	7	1
101	""	1351	84	7	0
102	May	1495	91	7	0
103	""	1537	83	7	0
104	""	1586	84	7	0
105	""	1650	80	7	0
106	05	1710	78	9	0
107	""	1811	81	10	1
108	""	1856	73	11	0
109	""	1927	61	11	1
110	""	2009	68	11	0
111	10	2042	65	11	1
112	""	2146	71	11	1
113	""	2146	62	11	0
114	""	2298	70	11	0
115	""	2372	73	14	0
116	15	2473	78	14	1
117	""	2531	75	15	0
118	""	2658	88	16	1
119	""	2727	83	16	1
120	""	2796	93	16	1
121	20	2863	80	18	1
122	""	2927	80	19	0
123	""	3067	85	19	1
124	""	3114	83	19	1
125	""	3176	74	20	0
126	25	3275	78	20	1
127	""	3322	75	20	0
128	""	3358	71	20	1
129	""	3446	74	21	0
130	""	3553	70	22	0
131	""	3656	77	22	1
132	""	3706	76	23	0
133	Jun	3771	71	23	1
134	""	3844	74	23	0
135	""	3886	76	23	0
136	""	3933	69	23	1
137	05	3991	63	23	0
138	""	4060	57	23	0
139	""	4117	59	23	0
140	""	4165	56	23	0
141	""	4216	54	23	0
142	10	4258	53	23	0
143	""	4291	51	23	0
144	""	4372	54	23	0
145	""	4426	53	24	0
146	""	4484	52	25	0
147	15	4534	53	25	1
148	""	4572	51	26	0
149	""	4639	54	26	1
150	""	4668	54	26	0
151	""	4841	67	26	0
152	20	4904	68	27	1
153	""	4960	68	27	0
154	""	4998	66	27	0
155	""	4988	60	27	1
156	""	5104	66	29	0
157	25	5174	73	29	0
158	""	5211	52	29	1
159	""	5260	51	29	0
160	""	5291	48	30	1
161	""	5342	49	31	0
162	""	5351	52	31	1
163	Jul	5391	41	33	0
164	""	5404	32	33	1
165	""	5450	35	46	2
166	""	5521	37	33	1
167	05	5570	40	34	0
168	""	5610	38	34	1
169	""	5610	37	34	0
170	""	5636	35	34	0
171	""	5697	42	34	1
172	10	5881	61	36	-2
173	""	5969	64	37	1
174	""	6044	68	37	0
175	""	6141	76	37	1
176	""	6170	80	38	0
177	15	6200	81	38	1
178	""	6276	82	38	0
179	""	6359	69	39	1
180	""	6430	65	39	0
181	""	6491	64	39	0
182	20	6544	58	39	1
183	""	6590	60	40	0
184	""	6625	61	41	0
185	""	6747	67	41	1
186	""	6806	64	42	0
187	25	6867	62	42	1
188	""	6927	62	42	0
189	""	7008	67	43	1
190	""	7055	66	45	0
191	""	7126	72	46	1
192	""	7183	62	46	1
193	""	7242	62	46	0
194	Aug	7308	63	46	1
195	""	7308	55	46	0
196	""	7364	51	46	1
197	""	7418	51	46	0
198	05	7489	52	48	0
199	""	7575	56	49	1
200	""	7664	61	49	0
201	""	7777	67	50	1
202	""	7875	81	50	0
203	10	7930	80	50	1
204	""	7952	77	50	0
205	""	8018	75	50	1
206	""	8116	78	50	0
207	""	8198	76	50	0
208	15	8260	69	50	0
209	""	8343	67	50	0
EOF

# confirmed:
set label "8343   " at first 209,834           left back textcolor "#ff8080"
# -~confirmed:
set label "67     " at first 209, 67*850/100   left back textcolor "#8080ff"
set label "93     " at first 120, 93*850/100+9 left back textcolor "#8080ff"
# deaths:
set label "50     " at first 209, 50*850/100   left back textcolor "#8080ff"
set label "50     " at first 201, 50*850/100+9 left back textcolor "#8080ff"
# -~deaths:
set label "0      " at first 209,  0*850/100   left back textcolor "#8080ff"
set label "2      " at first 165,  2*850/100+9 left back textcolor "#8080ff"

set multiplot
  plot $data using 0:($3/     10        ) with lines lc 7 lw 8 dt 1 title at 0.150, 0.920
replot $data using 0:($4/      1*850/100) with lines lc 6 lw 8 dt 4 title at 0.150, 0.902
replot $data using 0:($5/      1*850/100) with lines lc 6 lw 5 dt 2 title at 0.150, 0.884
replot $data using 0:($6/      1*850/100) with lines lc 6 lw 5 dt 3 title at 0.150, 0.866

# plot hor axis calendar
replot $data using 0:(0):xticlabel(2) with lines
|
File history
Click on a date/time to view the file as it appeared at that time.
| Date/Time | Thumbnail | Dimensions | User | Comment | |
|---|---|---|---|---|---|
| current | 19:09, 24 September 2020 |  | 3,300 × 1,950 (22 KB) | Jochen Burghardt (talk | contribs) | =={{int:filedesc}}== {{Information |description={{en|1=Diagram of WHO COVID-19 daily data (20 Jan - 16 Aug 2020) for ''"Total Confirmed Cases"'' (thick solid line), its smoothed increment (thick dash-dotted line), ''"Total Deaths"'' (thin dashed line), and its smoothed increment (thin dotted line); see File:WHO_Covid_2020_Jan-Aug_daily_C_Afghanistan.pdf for details.}} |date=2020-09-24 |source={{own}} |author=Jochen Burghardt |permission= |other_versions=[[:File:... |
You cannot overwrite this file.
File usage on Commons
There are no pages that use this file.