File:World-Oil-Logistic.svg
Jump to navigation
Jump to search

Size of this PNG preview of this SVG file: 512 × 384 pixels. Other resolutions: 320 × 240 pixels | 640 × 480 pixels | 1,024 × 768 pixels | 1,280 × 960 pixels | 2,560 × 1,920 pixels.
Original file (SVG file, nominally 512 × 384 pixels, file size: 34 KB)
Captions
Captions
Add a one-line explanation of what this file represents
Summary[edit]
| Description |
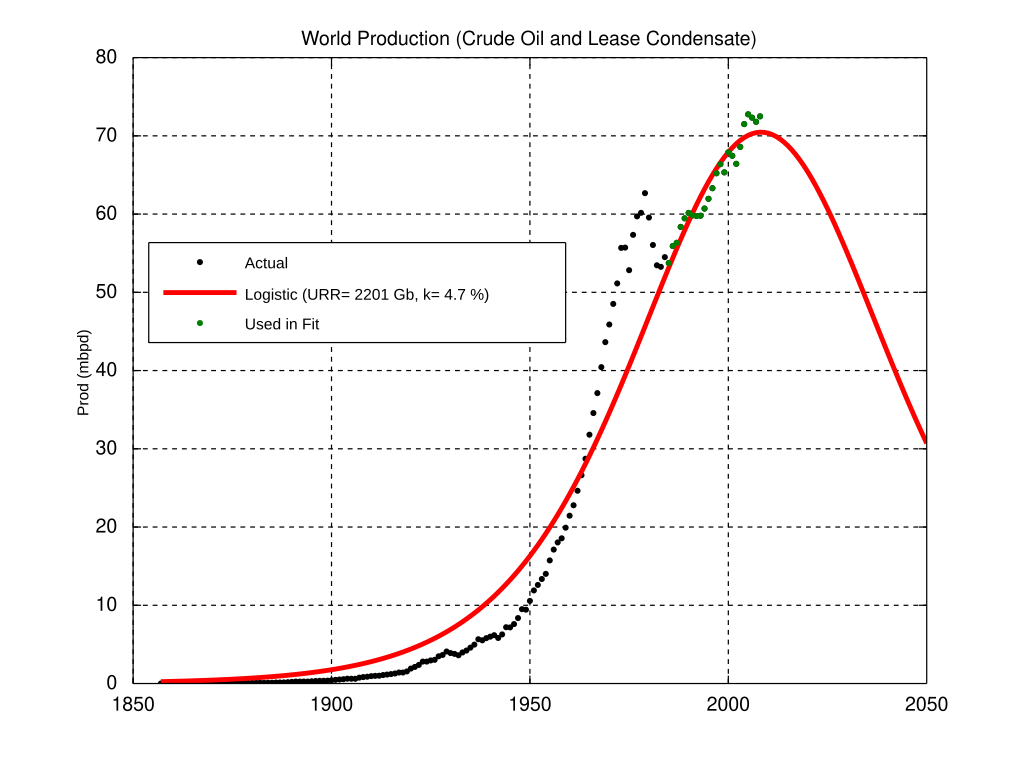
English: World oil production (crude oil only plus lease condensates, exclude Canadian tar sands), data from the US Energy Information Agency. Logistic fit using the Hubbert Linearization technique. |
| Date | 03:29, 17 November 2009 (UTC) |
| Source | Own work (Original text: I (Sfoucher (talk)) created this work entirely by myself.) |
| Author | Sfoucher (talk) |
| SVG development | This vector image was created with an unknown SVG tool. This file uses embedded text that can be easily translated using a text editor. |
Licensing[edit]
| This chart is ineligible for copyright and therefore in the public domain, because it consists entirely of information that is common property and contains no original authorship. For more information, see Commons:Threshold of originality § Charts
|
File history
Click on a date/time to view the file as it appeared at that time.
| Date/Time | Thumbnail | Dimensions | User | Comment | |
|---|---|---|---|---|---|
| current | 03:29, 17 November 2009 | | 512 × 384 (34 KB) | Sfoucher (talk | contribs) | {{Information |Description = |Source = I (~~~) created this work entirely by myself. |Date = ~~~~~ |Author = ~~~ |other_versions = }} |
You cannot overwrite this file.
File usage on Commons
There are no pages that use this file.