User:HenkvD/Articles
Gompertz model en.wikipedia (2010 - 2012/14)[edit]
The Gompertz model is based on the en:Gompertz function. This function is is like a logistic function, but the future value asymptote of the function is approached much more gradually, in contrast to the logistic function in which both asymptotes are approached by the curve symmetrically.
The reasons for this new model are
- The growth function does not seem to be symetrical, as the logistic function
- The percentage of article growth per month in the logarithmic graphs seem to be linear ( (1) and (2) ), as the Gompertz function
The formula for the Gomertz function for the en.wikipedia is , with

- a= 4378449 (the predicted maximum for about 4.4 million articles)
- b= -15.42677
- c= -0.384124
- t is the time in years since 1/1/2000 (so 1/1/2010 is t=10.00)
The expected maximum of Gomertz model is between the logistic model and the Modelling Wikipedia extended growth.
See below 3 Gompertz model graphs, followed by 3 corresponding graphs of the Logistic model, a graph for a general comparison between the Logistic, Gompertz and the Extended Growth models, and a graph of the top 20 wikipedia's which in general show the same behavior in Percentage of article growth.

|

|

|
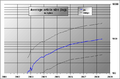
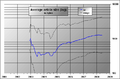
| Number of article growth on en.wikipedia.org and Gompertz extrapolation |
Number of articles on en.wikipedia.org and Gompertz extrapolation |
Percentage of article growth per month on en.wikipedia.org and Gompertz extrapolation |

|

|

|
| Same graphs for logistic model with extrapolation to 3, 3.5 and 4 million articles | ||

|

| |
| Comparison of number of articles growth on en.wikipedia.org and Logistic, Gompertz and Extended Growth extrapolations |
Percentage of article growth per month of the Top Wikipedias | |
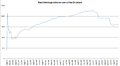
New Wikipedia Articles per Month of the Top Wikipedias[edit]
The 3 graphs below show the number of new Wikipedia articles created per month for the top Wikipedia's.
As shown the growth has peaked in 2006, 2007 or 2008 for the different wikipedias.

|

|

|
|
| New Wikipedia Articles per Month of the Top Wikipedias | Idem, showing the smaller wikis in more detail | Idem in logarithmic form | % Growth per Month |
Article sizes of top 10 wikipedias[edit]
Article size over time of top 10 wikipedias. Average and ranges as en:Log-normal distribution.
For description see en:User:HenkvD/Articlesize.
-
 Article size top 10 wikipedias
 -
 en: wikipedia (updated until Jan 2010)
 -
 de: wikipedia
 -
 ja: wikipedia
 -
 fr: wikipedia
 -
 it: wikipedia
 -
 pl: wikipedia
 -
 es: wikipedia
 -
 nl: wikipedia
 -
 pt: wikipedia
 -
 ru: wikipedia
 -
 Quality?


Logistic growth on de.wikipedia[edit]
In the section below I tried to model the en.wikipedia acticle count into a logistic model. As there are no database dumps for en.wikipedia to be used for further analysis I look into more detail into the German situation.

|

|

|
| Article growth on de.wikipedia | Growth on de.wikipedia | Same graph in logarithmic form |
I graphed 5 statistics in a way that it shows the growth rate. In case of total absence of users these growth rates will all be zero.
- New articles per month
- Words Growth
- Database edits per month
- New Wikipedians per month
- Very active Wikipedians
First of all I noticed the unusual growth in March 2004, which shows on all 5 statistics, but most clearly at New articles and at New Wikipedians. This period is marked with the red elips on the both graphs. Probably caused by a report in the newsshow "Tagesthemen" on tv at 25.2.2004.
Secondly I think these graphs shows the signs of logistic growth on these 5 statistics, but most clearly at New wikipedians. The number of new Wikipedians at 1/2008 is less than 40% of the numbers at its maximum (during 2006).
The pivot points (Wendepunkte) are probably around:
- Sept 05 - Apr 06 for New Wikipedians per month
- Sept 2006 for New articles per month
- Sept 2006 for Words Growth
- April 2007 for Database edits per month
- June 2007 for Very active Wikipedians
Update Until 30/11/2008[edit]
- There is a new maximum at May 2008 for Very active Wikipedians
- The number of new Wikipedians at 11/2008 is about 20% of the numbers at its maximum (during 2006).
Logistic model en.wikipedia (2006 - 2010)[edit]
My extrapolation of article growth on en.wikipedia.org
The logistic model of wikipedia article growth:
- more content leads to more traffic
- more trafic leads to more content
- limit is the combined expertise of the possible participants.
Based on:
- extrapolation started at 1 million articles per 1/3/2006 (62 months after 1/1/2001)
- not exponential growth, but a maximum in articles in the form of a cumulative Gauss (or logistic function)
- lines for 3, 3.5 and 4 million articles as expected number of articles (up to Dec 2008 lines for 3, 4 and 5M)
- the result is that the number of article growth per month is a gauss curve
- the actual growth is rather unpredictable
- lines for 3, 4 and 5 million articles as expected number of articles
- I expect a maximum number of article growth in 1 or 2 years (after 1/3/2006)
|
|

| |
| Number of articles and extrapolation to 3, 3.5 and 4 (in the form of a cumulative gauss) |
Same graph in logarithmic form | |

|
|
|
| Article growth per month | Article growth per month (6 months avarage) | Percentage growth per month. |

| ||
| 1/9/2006: 2nd derivative of growth per month The graph is not conclusive but I hope/guess the 2nd derivative will go down (to zero) in a year or so.(img 1/9/2006) 28/2/2007: Almost a year after my predictions the 2nd derivative is now convingingly below the x-axis. The top of articlegrowth is now probably reached. (img 28/2/2007) |
I expect:
- the absolute maximum in the number of articles in en.wikipedia.org will be around 5 million articles (± 1 million)
- This maximum will be reached (or 95 % of it) at 2013
- 10 million articles will never be reached (see 10 million pool#Never)
Exponential or Logistic function?[edit]

Graph of the number of articles on en.wikipedia with Exponential and Logistic extrapolation (resp. User:Diegotorquemada and User:HenkvD).
Judge for yourself. (HenkvD 21:03, 2 March 2007 (UTC))
See also[edit]
- en:Wikipedia:Modelling Wikipedia's growth
- en:Image:WPsize.png
- en:Image:Wikipedia-growth.png en: wikipedia edits per day
- en:User:Dragons flight/Log analysis
- ChartsWikipediaNL (see New wikipedians)
 , de:Benutzer_Diskussion:Ephraim33#Diagramme (archiv), de:Wikipedia:Kurier/Ausgabe_1/2_2008#Wendepunkt_durchschritten (20.1.2008, Wendepunkt durchschritten)
