User:Redtitan
| About me | ||||||
|---|---|---|---|---|---|---|
|
I'm Redtitan, a passionate plant, GIS, and climate nerd. I have a M.S. Degree in Crop Science from Washington State University and a MGIS Degree from the University of Washington.
I've added climate data (weatherboxes), along with Köppen climate classifications, to various locations in the Western United States. So far, I've updated most the available cities/towns in Washington, Alaska, Oregon, Northern California, and N. Idaho, which have available climate data on the Western Regional Climate Center website.
Most of my work has centered around making Köppen maps in GIS for various states, provinces, countries, etc. I made a lot of maps in 2016, and am slowly starting again in 2018, making new maps that I hope are a bit higher quality.

|
The Graphic Designer's Barnstar | |
| Thank you very much Redtitan for your wonderful climate maps. AuroralColibri (talk) 18:57, 1 November 2016 (UTC) |

|
The Teamwork Barnstar |
| You have AWESOME Koppen Maps. Keep up your great work! Manualy20 (talk) 02:24, 14 August 2017 (UTC) |
Köppen map disclaimer[edit]
I'm using climate raster data that was calculated by climatologists and is publicly available through WorldClim.org (or in the case of the U.S. states, data from PRISM). I don't have any subjective control over where the Köppen climate types go. I simply enter the criteria for the Köppen climate types and the program that I use computes them. The WorldClim.org dataset that I use also doesn't have perfect coverage, like any other climate dataset out there. Since it's imperfect, it may inaccurately calculate climate type coverage for some areas.
That being said, I think the WorldClim.org dataset has some advantages over existing Köppen climate data sets. For instance, it accounts for elevation, which the Peel et al. data does not. It also has greater precision, with a ratio of 1 pixel = 1 km. It's the best I've found so far, and I think it's one of the best out there.
The PRISM dataset is really one of the highest quality worldwide, and also accounts for elevation. I've used this set for the lower 48 contiguous states of the US. Sadly, they left out Alaska and Hawaii in their coverage, and so for those two states, I've used the WorldClim.org data.
Köppen climate quirk: Area with summer rainfall maximum having a Csb/Csa climate.[edit]
This can happen, strangely enough. It makes me quite uncomfortable too, but following the rules of the Köppen climate classification system, it's possible. And since I'm following the rules, my maps will reflect those rules even if they don't make sense.
Let me explain how this can occur:
For a climate to qualify as Cs, it must match the following criteria: (literature reference: http://koeppen-geiger.vu-wien.ac.at/pdf/Paper_2006.pdf)
- 1) The driest month in the summer half-year (April-September) must have a monthly precipitation <40 mm.
- 2) The driest month in the summer half-year must be lower than the driest month in the winter half year (October-March).
- 3) The driest month in the summer half-year must be less than 1/3 as wet as the wettest month in the winter half year.
Let's use Flagstaff, Arizona as an example. It's correctly listed as Csb/Dsb on its wiki page. The weatherbox won't display in my Wikimedia Commons user page, so refer to my Wikipedia User page or the Flagstaff, Arizona wiki page to find the weatherbox.
As you can see, the wettest month in Flagstaff, Arizona is in August. Hardly a dry-summer climate, right?! However, it does meet all the above criteria. However, what most people don't realize is that Köppen goes by half-years for summer and winter. So in this case, even though June is mostly in spring, it can be the driest summer month, which definitely meets requirement #1. June's precipitation (9.1 mm) is certainly drier than October (42.2 mm), so it meets requirement #2. And June is definitely less than 1/3 as wet as the wettest month of the winter half-year, February (54.9 mm), so requirement #3 is also met.
So Flagstaff is Csb (assuming you use the -3 isotherm to separate C from D climates, otherwise, it'd be Dsb), and its rainiest month is the middle of summer. Nobody said Köppen always made sense! The same quirk holds for much of highland Mexico as well.
FAQ[edit]
Mapmaking[edit]
You made an error - can you change the map and fix it? What if I give you some climate data?
Yes, but unfortunately it's complicated, I probably can't change the map in the way you think I can, it takes me a long time, and the result won't look good.
I can't integrate climate station data into the map seamlessly. I'm working with climate data raster files that have already been calculated using some fairly advanced computing tools. You can think of what I'm doing as a very complex version of colorizing a portrait. I can't change the portrait. I'm simply choosing which colors to add to it, using climate data embedded in the individual pixels of the raster files I work with.
The only edit I can really do is to manually draw boundaries around the weather stations and make blind estimates about how much the climate type extends around them. It's the equivalent of using the freehand tool in Microsoft Paint.
It's a very long process that isn't fun, and I'm here to both help out and have fun. If I'm not having fun, then I'd rather help out in a way that is fun and do other work that needs to be done. If you'd like to try to make modifications on your own, I'd be happy to see you do that (assuming the changes are accurate and are backed up by citable sources).
A quick suggestion to any potential map editors: because Wikipedia prefers SVG files, I'd encourage you to use a program like Inkscape (which is totally free and not to difficult to learn). You can load my maps in the SVG format from Wikimedia commons, then save them back to SVG in Inkscape. That way, we can avoid really blurry JPGs, which nobody likes.
I've found a climate map from my country's meteorological agency. It shows the correct distribution of Köppen climate types in my country. Please make a map like that.
I very likely can't, due to copyright issues. It'd be a derivative work. There are some great Köppen maps produced from individual countries that I wish we could include on Wikipedia. However, if a country doesn't release its map into the public domain, we can't use it here directly and I can't make a derivative map of it. A good example of this is for Spain, which has released a great Köppen map in conjunction with Portugal. However, it has two copyrights on it - one for each of the countries' respective meteorological agencies.
Many people have tried uploading those Köppen maps anyway, and they always get deleted. Keep in mind, you could always put a link to that map at the end of the article.
I found a climate raster file, including monthly climate normals for mean temperature and precipitation. Can you use that?
Yes! Now we're talking! And you understand mapmaking. I can definitely use climate rasters. Many countries have their own climate data that's more accurate and precise. However, it's often not in English and so I'm not great at finding it on my own. If you're able to locate climate rasters from your country's GIS portal or meteorological agency, in .asc or .bil format, I can definitely use that and would be happy to generate a map from that.
I disagree with the climate you say I live in. I don't live in a mediterranean/oceanic/subtropical humid/etc. climate.
The Köppen climate classification system makes some categorizations that make some people upset, since it can contradict people's own perceptions of their own climates. For instance, if you live in Seattle, you might balk at being told you live in a 'Mediterranean climate'. I live in a temperate rainforest in Washington state, and I'm classified as Csb, 'warm-summer Mediterranean', so I'm located well within one of the areas where the Köppen system is said to make little sense. I'm really not too upset about it though.
That being said, the system is objective, using set standards based on temperature and precipitation. It's the best system we've got and has widespread support in the literature and within the field of climatology. If you live at the edge of the boundary of a particular climate type, maybe check out Trewartha instead? Although it certainly has its issues too . . . However how you draw the boundaries, someone's going to be upset. Whatever the case, I'll be there to draw maps of it. Direct your anger at the system itself, not me, the mapmaker!
As one of the few people who's made a Trewartha map (honestly, after much searching, there appear to be no new publicly available Trewartha maps since the world map from Trewartha and Horn's last textbook in 1980), I can at least say I'm the only mapmaker on here who's given alternate systems a chance. Hopefully with time, a better system will come along that makes sense and corrects some of more blatant flaws in Köppen, but is actually complete, unlike Trewartha (long story).
Your map is inaccurate!
It very well could be, most likely due to the datasets I'm using. I use two main datasets to calculate the Köppen types: for the contiguous United States, I used the PRISM dataset; for the rest of the world, I've used the WorldClim.org dataset. These are based on 30 year climate normals calculated over a particular range of dates. It could be that these two data sets have gaps in coverage, leading to inaccurate climate types for particular areas where there isn't a weather station. It could also be that the climate type for the 30-year period differs from the climate information you're referring to, particularly if that climate information has been averaged over a long period of time (e.g. climate averages from 1890-2015 might be a bit different than 1981-2010 climate normals).
I tried my best to find the best quality datasets available for the locations I make maps for. However, climate rasters are never perfect. Even with the PRISM dataset - considered one of the most accurate climate datasets out there - there's some areas where I slightly disagree with the resulting types. However, these datasets are the best we have yet, and I feel these are an improvement off previous climate maps.
I disagree with the thresholds you use.
There isn't 100% agreement about the boundaries of the Köppen climate classification types. Personally, I follow the thresholds given here: http://koeppen-geiger.vu-wien.ac.at/pdf/Paper_2006.pdf.
Since there's no agreement on this, I chose the thresholds that seemed in most widespread use and were present in the literature. My aim isn't to push any one particular set of thresholds as more valid than another (unless they're not reflected in the literature). That's why I list the threshold at the bottom of the map. I'm trying to be transparent. If you feel really upset at these particular thresholds, feel free to construct maps using the thresholds you feel are more valid.
Can you make a worldwide/continent level map?
Yes and no. The only time I've been able to do an entire continent in one run was with Australia, due to its small size. With the program I'm using, it takes a very long time to process the raw climate data for such a large area and classify it according to the Köppen climate classification system. Australia took the whole day. With Canada, I had to piece together multiple sections of the country. Anything larger and my computer would freeze up. I hope to get there some day, either by having a computer with much greater computing power or by eventually piecing together individual country maps into a worldwide version. I'm close to doing that with Europe and North America.
My country uses a modified Köppen system. Can you make a map of my country using that system?
Yes! I'd be really happy to and have been wanting to do this. If you supply me with the thresholds for the different climate types of the modified system, I can calculate them and make a map. Or if you have a journal article or academic source in English or German that describes the modified system, you can just send that my way and I can look up the types on my own.
My only requirements for making such a map are
- 1) There is a source in the literature for this modified system, or at least a webpage from a university that can be linked to.
- 2) In the map that I make, I will mention that I'm using a modified version of the Köppen system in the title. I don't want people to confuse it with the main Köppen system.
Where did you come up with your naming convention for the Köppen types?
I wish there was a standardized naming convention for the Köppen types that I could follow, but I haven't found a complete standardized convention in the literature. Generally, I've kept with the wording used on the Wikipedia article for the Köppen climate classification system. I did rename a type myself (Köppen Csc) which was called 'dry-summer maritime subalpine climate' in places. Going off the partial naming conventions found in two articles (listed on the talk page for that wiki article), I named it 'cold-summer Mediterranean'.
Hopefully, a standardized naming convention will develop. If so, I might work on renaming the types in my maps, although that would not be an easy process and would take several days to do.
Climate geekery[edit]
What's your favorite climate type?
I'm quite fond of Csb, having lived in it most of my life. The dry, sunny summers are great and where I live, they're generally not that hot. The enduring cloudy weather of the other nine months of the year actually suites me, although it can get a bit old around February and March.
That being said, different climate types sound better at different points of the year.
In winter, I tend to envy continental climate types, with their heavy snowfall. We rarely get significant accumulations in western Washington. In spring, I wish I lived in climate with more moderate winters, when I see that my frost-susceptible plants have all died. In summer, when we do have heat waves, I can sometimes start to envy Cfb types further up north from me, which have more moderated summers, or more coastal Csb climates, especially in areas along the Oregon coast which are heavily moderated by the California Current. In fall, I'm pretty happy.
How did you get interested in the Köppen climate classification system and climatology?
As a kid while conworlding. This page in particular is where I learned about Köppen for the first time: https://astrographer.wordpress.com/bookshelf/geoff-eddys-climate-cookbook/
I wanted to create a world with an accurate geography, and so I learned about Köppen types to make sure everything was realistic.
Are there places where Köppen climate or climate in general is discused?
There are! Sometimes Wikipedia talk pages can be a bit more argumentative. If you want to talk subjectively about your favorite climate type, check out the forum on city-data.com.
Contributions[edit]
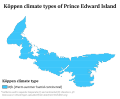
Köppen climate maps of North America[edit]


Köppen climate maps of the United States, states[edit]


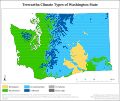
Köppen climate maps of the United States, sub-state level[edit]


Köppen climate maps of the United States, regions[edit]


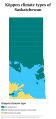
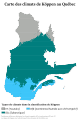
Köppen climate maps of Canada, provinces[edit]
-
-

-

-

-

-
-

-

-

-
 French translation (translation credits: Pierre cb, Riba)
 -

-

-
 French translation (translation credits: Pierre cb, Riba)
 -

-
 French translation (translation credits: Pierre cb, Riba)
 -


Köppen climate maps of Canada, sub-province level[edit]


Köppen climate maps of Canada, regions[edit]


Köppen climate maps of Europe[edit]


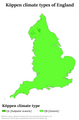
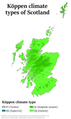
Köppen climate maps of the United Kingdom[edit]
-

-

-
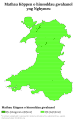 Welsh translation (translation credits: Llywelyn2000)
 -
-
-
 Scots translation (translation credits: Munci)
 -


Köppen climate maps of Ireland[edit]
-
 ROI only
 -
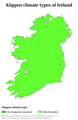 Whole island
 -
 Gaelic translation (translation credit: CalzGuy)


Köppen climate maps of Europe, sub-national areas[edit]


Köppen climate maps of Australia[edit]


Köppen climate maps of South America[edit]


Köppen climate maps of Chile, administrative divisions[edit]


Köppen climate maps of Africa[edit]


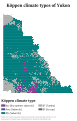
Köppen climate maps of Asia (or Eurasian countries)[edit]


Köppen climate maps of Oceania[edit]

Misc. Köppen maps[edit]

Other U.S. Climate Maps[edit]
-
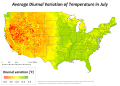 Diurnal temperature variation, July

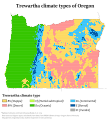
Trewartha climate maps[edit]
-
 Trewartha climate map of the contiguous US
 -
-