Category:Cell cycle
Gezinti kısmına atla
Arama kısmına atla
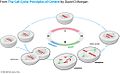
progression of biochemical and morphological phases and events that occur in a cell during successive cell replication or nuclear replication events | |||||
| Medya yükle | |||||
| Nedir | |||||
|---|---|---|---|---|---|
| Alt kümesidir | |||||
| Konumu | hücre | ||||
| |||||
Alt kategoriler
Bu kategoride, aşağıdaki 19 alt kategori dahil toplam 19 alt kategori vardır.
A
- Cell cycle arrest (10 F)
C
D
G
I
- Cell cycle inhibitors (6 F)
- Interphase (19 F)
P
- Preprophase band (9 F)
R
S
- S phase (43 F)
"Cell cycle" kategorisindeki ortam dosyaları
Bu kategoride yer alan toplam 127 dosyanın 127 adedi aşağıdadır.
-
 1z2c asr r 500.jpeg 500 × 500; 46 KB
-
 2B9R.png 640 × 480; 142 KB
-
 Amitóza.PNG 940 × 716; 33 KB
-
 APC B-TrcP.jpg 751 × 462; 54 KB
-
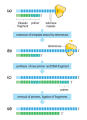
 Asymmetry in the synthesis of leading and lagging strands.svg 512 × 910; 142 KB
-
 Bivalent rus.jpg 465 × 313; 33 KB
-
 Bivalent.png 465 × 313; 65 KB
-
 Bunecny cyklus1.jpg 512 × 546; 33 KB
-
 CBP and the Cell Cycle.jpg 660 × 367; 27 KB
-
 Cdc4 structure.jpg 500 × 500; 44 KB
-
 Cdk phosphorylation.png 544 × 1.018; 114 KB
-
 Cdr2 pathway.jpg 196 × 195; 9 KB
-
 Cell cycle (13061896675).jpg 1.191 × 400; 98 KB
-
 Cell Cycle 2.png 512 × 512; 27 KB
-
 Cell Cycle 3.png 1.986 × 1.992; 161 KB
-
 Cell cycle and CDK.jpg 960 × 720; 58 KB
-
 Cell cycle bifurcation diagram.jpg 2.268 × 1.134; 300 KB
-
 Cell cycle simple pl.png 1.354 × 768; 76 KB
-
 Cell cycle simple.png 1.354 × 768; 65 KB
-
 Cell cycle with images.jpg 3.600 × 3.228; 936 KB
-
 Cell Cycle-es.jpg 500 × 481; 60 KB
-
 Cell cycle.JPG 621 × 379; 26 KB
-
 Cell cycle.png 358 × 347; 4 KB
-
 Cellcycle and growth.png 550 × 210; 20 KB
-
 Cellcycle.png 701 × 551; 59 KB
-
 Chromosome cohesion - en.png 960 × 720; 26 KB
-
 Ciclinas y ciclo celular.png 935 × 439; 31 KB
-
 Ciclo delle cicline.jpg 439 × 199; 73 KB
-
 Cycle cellulaire.jpg 819 × 460; 91 KB
-
 Cyclin-Cdk.JPG 142 × 137; 3 KB
-
 CyclinD.jpg 500 × 500; 54 KB
-
 Cyclinexpression waehrend Zellzyklus es.png 422 × 186; 4 KB
-
 Cyclinexpression waehrend Zellzyklus.png 422 × 186; 4 KB
-
 Cyclins inhibitors.png 720 × 540; 6 KB
-
 Cytokinesis illustration.svg 512 × 512; 78 KB
-
 Dimer Mad1 Mad2.png 800 × 600; 222 KB
-
 DREAM complex disassembly.png 739 × 440; 46 KB
-
 E2F family member.png 876 × 537; 31 KB
-
 Endocycling vs. endomitosis.png 985 × 775; 109 KB
-
 Endomitosis.png 233 × 477; 22 KB
-
 Eukaryotic replication cycle.png 432 × 578; 72 KB
-

-
 Feedbackims.jpg 550 × 238; 45 KB
-
 Ferrell.jpg 661 × 389; 628 KB
-
 Fission yeast cell cycle structure.jpg 719 × 131; 20 KB
-
 Fission yeast cytokinesis.jpg 1.101 × 215; 82 KB
-
 Fungus cell cycle-en.svg 2.310 × 1.491; 2,74 MB
-
 G0 and early G1 DREAM complex.png 733 × 493; 43 KB
-
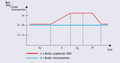
 G2-M Bistability.png 1.347 × 1.012; 49 KB
-
 G2-M feedback loops.png 1.141 × 1.125; 142 KB
-
 General cell cycle.jpg 1.025 × 636; 80 KB
-
 Inhibition of pre-RC assembly.png 497 × 330; 12 KB
-
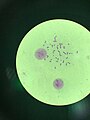
 Interphase and Metaphase labeled on Onion Root Microscopic Image.png 1.200 × 900; 1,48 MB
-
 Irreversible and Bistable Switch in Mitotic Exit.jpg 960 × 633; 52 KB
-
 JAK-STAT MAPK PI3K Crosstalk.png 947 × 535; 53 KB
-
 Lifecycle diagram.svg 744 × 1.052; 55 KB
-
 MAD1 function in SAC.jpg 759 × 297; 25 KB
-
 Mdia1 domains.jpg 320 × 70; 23 KB
-
 Metaphase1.jpg 4.032 × 3.024; 1,43 MB
-
 Metaphase3.jpg 3.024 × 4.032; 1,49 MB
-
 Metaphase6.jpg 1.280 × 960; 122 KB
-
 Mitose 3.jpg 720 × 540; 39 KB
-
 Mitosepanel-gl.jpg 1.050 × 246; 41 KB
-
 Mitosis (13083175463).jpg 595 × 842; 61 KB
-
 Mitosis cells sequence English.svg 774 × 115; 494 KB
-
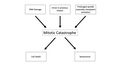 Mitotic Catastrophe Diagram 2.png 2.958 × 1.664; 192 KB
-
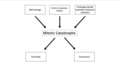 Mitotic Catastrophe Diagram.png 1.704 × 962; 99 KB
-
 Mitotic cycle.png 720 × 540; 124 KB
-
 Morgansystem.jpg 733 × 449; 647 KB
-
 Multipolar spindles in cancer cell..tif 1.392 × 1.040; 4,16 MB
-
 Multipolar spindles with chromosomes under DAPI fluorescent stain..tif 1.392 × 1.040; 4,16 MB
-
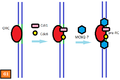
 MYBL2 in cell cycle.png 588 × 348; 17 KB
-
 MécanismeRégulation 2.jpg 720 × 540; 53 KB
-
 Network picture.png 346 × 259; 56 KB
-
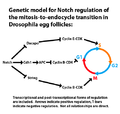 Notch regulation of endocycling.png 519 × 493; 36 KB
-
Nr0b1-is-a-negative-regulator-of-Zscan4c-in-mouse-embryonic-stem-cells-srep09146-s2.ogv 16 sn, 240×240; 155 KB
-
 Origin Licensing.png 497 × 330; 10 KB
-
 Overview of chromosome duplication in the cell cycle.svg 512 × 488; 166 KB
-
 P. Ehrlich, "On Immunity...," diagrams Wellcome L0033026.jpg 3.885 × 4.656; 8,19 MB
-
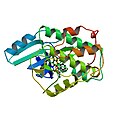 PBB Protein CDK2 image.jpg 500 × 500; 42 KB
-
 PBB Protein WEE1 image.jpg 500 × 500; 37 KB
-
 Plant cell cycle.svg 1.440 × 1.240; 3,51 MB
-
 Prometaphase-ukr.svg 3.856 × 1.380; 84 KB
-
 Regulación ciclo celular.png 720 × 540; 194 KB
-
 Regulation of cell cycle.png 1.122 × 1.588; 84 KB
-
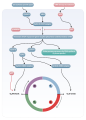 Regulation of the cell cycle.svg 1.134 × 1.584; 118 KB
-

-
 S07-02-kletochnyj-cikl.jpg 238 × 135; 4 KB
-
 SCF (ru).svg 496 × 172; 26 KB
-
 SCF Morgan.jpg 338 × 517; 54 KB
-
 SCF(Fbw7).PNG 500 × 500; 141 KB
-
 Schéma de la mitose.png 816 × 798; 224 KB
-
 Schéma récapitulatif des principales phases du cycle cellulaire.jpg 3.112 × 2.982; 1,79 MB
-
 Sic1 David Morgan10-5.jpg 721 × 351; 38 KB
-
 Sic1 fig1.jpg 2.296 × 812; 129 KB
-
 Signal transduction pathways (zh-cn).svg 1.858 × 1.364; 146 KB
-
 Signal transduction v1.png 1.858 × 1.364; 253 KB
-
 Single and double chromosomes.png 162 × 183; 4 KB
-
 Skotheimsystem.jpg 573 × 572; 648 KB
-
 Small cell.jpg 575 × 126; 20 KB
-
 Spindle assembly checkpoint (attached).svg 431 × 253; 28 KB
-
 Spindle assembly checkpoint (unattached).svg 431 × 253; 28 KB
-
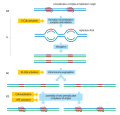
 Steps in DNA synthesis.svg 512 × 921; 259 KB
-
 Synthesis of chromosome ends by telomerase.svg 512 × 704; 160 KB
-
 Telomere bouquette.png 493 × 558; 223 KB
-
 Tetrad.png 399 × 283; 57 KB
-
 Tetramer Mad1 Mad2.png 1.024 × 768; 166 KB
-
 The cell cycle (13083554653).jpg 427 × 489; 28 KB
-
 The cell cycle.jpg 466 × 361; 47 KB
-
 The Cell Cycle.svg 379 × 378; 32 KB
-
 The events of the eukaryotic cell cycle.pdf 1.500 × 750; 795 KB
-
 The functions of CAK in different species (ru).svg 1.710 × 673; 43 KB
-
 The inhibition of a Cdk6 by a CKI INK4.svg 516 × 372; 42 KB
-
 The inhibition of a cyclin A-Cdk2 complex by a CKI p27 (ru).svg 995 × 510; 42 KB
-
 Three cell growth types es.png 499 × 507; 191 KB
-
 Three cell growth types mk.svg 733 × 700; 347 KB
-
 Three cell growth types-el.png 538 × 524; 152 KB
-
 Three cell growth types-ru.svg 694 × 700; 241 KB
-
 Three cell growth types-sl.png 499 × 507; 196 KB
-
 Three cell growth types.svg 694 × 700; 284 KB
-
 Via per la qual mROS indueix la proliferació cel·lular.gif 532 × 539; 794 KB
-
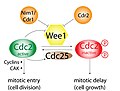 Wee1 role regulation.jpg 769 × 586; 141 KB
-
 Whole Genome Doubled Instability.png 4.431 × 1.319; 667 KB
-
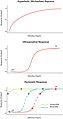 Wikiresponsecurves1.jpg 1.832 × 3.460; 686 KB
-
 Zellzyklus.png 960 × 960; 232 KB
-

-


.gif)


.jpg)


.PNG)


.svg)
.svg)


.jpg)


.svg)


.jpg)
.svg)
.svg)
.svg)