Category:Energy transition
Przejdź do nawigacji
Przejdź do wyszukiwania
proces modyfikacji gospodarek i sieci energetycznych na bardziej zrównoważone | |||||
| Prześlij plik multimedialny | |||||
| Jest to | |||||
|---|---|---|---|---|---|
| Podklasa dla | |||||
| Składa się z |
| ||||
| |||||
Podkategorie
Poniżej wyświetlono 6 spośród wszystkich 6 podkategorii tej kategorii.
Pliki w kategorii „Energy transition”
Poniżej wyświetlono 76 spośród wszystkich 76 plików w tej kategorii.
-
 12 Brief lessons on Europe's energy transition-crop.jpg 2295 × 3050; 444 KB
-
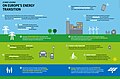 12 Brief lessons on Europe's energy transition.jpg 4606 × 3050; 1,2 MB
-
 1776 Historical energy consumption - U.S. - EIA data.svg 1200 × 675; 6 KB
-

-
 1990- Renewable energy production, by source cs.svg 1000 × 750; 5 KB
-
 1990- Renewable energy production, by source.svg 1000 × 750; 5 KB
-
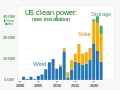 2000- Clean power installation - wind, solar, storage - US.svg 1000 × 750; 3 KB
-
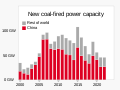 2000- New coal-fired power capacity - Global Energy Monitor.svg 1000 × 750; 4 KB
-
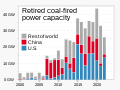 2000- Retired coal-fired power capacity - Global Energy Monitor.svg 1000 × 750; 6 KB
-
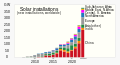 2007- New solar installations - annually by country or region.svg 1250 × 675; 6 KB
-

-
 2010- Cost of renewable energy - IRENA.svg 1000 × 750; 8 KB
-
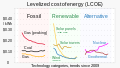
 2010- Decreasing renewable energy costs versus deployment.svg 1000 × 750; 5 KB
-
 2010- Fossil fuels vs Wind + Solar - electricity generation.svg 859 × 750; 8 KB
-

-
 2015- Clean energy vs fossil fuel investment - IEA.svg 1000 × 750; 3 KB
-

-

-
-
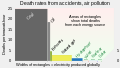 2021 Death rates, by energy source.svg 1200 × 675; 3 KB
-

-
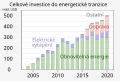 20210119 Renewable energy investment - 2004- BloombergNEF cs.svg 512 × 346; 11 KB
-
 20210119 Renewable energy investment - 2004- BloombergNEF-cs.svg 850 × 575; 39 KB
-
 20210119 Renewable energy investment - 2004- BloombergNEF.svg 1200 × 675; 6 KB
-
 20220314 Renewable electricity generation - United States.svg 1075 × 750; 7 KB
-

-
 2050 energy mix.jpg 2067 × 1250; 275 KB
-

-
 Actoranalysis.jpg 774 × 821; 47 KB
-
 Battery-cost-learning-curve.png 1773 × 2106; 188 KB
-
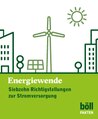
 BOeLL-FF Energiewende S 8.jpg 1748 × 2126; 745 KB
-
 Capture d’écran transition énergétique.png 1098 × 324; 237 KB
-
 Carbon prices.png 1121 × 705; 75 KB
-
 CO2 reductions needed to keep global temperature rise below 2C 1950 - 2100.png 3400 × 2400; 1,04 MB
-
 Components of the future.jpg 1004 × 1300; 173 KB
-
 Electricity price variation Germany.svg 1000 × 500; 38 KB
-
 Electricity share by fuel source, OWID.svg 850 × 600; 15 KB
-
ENERGIE- Hoe kun jij met kattenbakvulling je huis verwarmen-.webm 14 min 51 s, 1920 × 1080; 190,89 MB
-
 Energy consumption by source, OWID.svg 850 × 600; 47 KB
-
 Energy transition petrol to electric.png 721 × 589; 429 KB
-
 Energy Transition Timeline.pdf 2750 × 1629; 786 KB
-
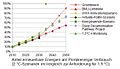
 Entwicklung des weltweiten Energiemixes bis 2050.jpg 800 × 586; 239 KB
-
 Estimated Effect of Carbon Tax in US.png 1322 × 888; 30 KB
-
 Evolution of global electricity demand 1990-2025.png 1920 × 1080; 112 KB
-
-
 From energy consumer to participant the potential for 2050.jpg 2067 × 1350; 322 KB
-
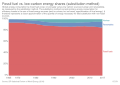
 Global energy consumption by source (substitution method), OWID.svg 850 × 600; 46 KB
-

-
 Global mining areas and their density.webp 1742 × 871; 190 KB
-
 Global primary energy consumption by source 1900 - 2021.png 3400 × 2400; 525 KB
-
 Global primary energy consumption by source, OWID.svg 850 × 600; 13 KB
-
 Global primary energy consumption by source.png 1817 × 845; 104 KB
-
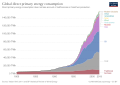 Global primary energy consumption, OWID.svg 850 × 600; 54 KB
-
 Investment in renewable energy, by technology, OWID.svg 850 × 600; 18 KB
-
 Key features of energy transition in Southeast Asia.png 1337 × 891; 512 KB
-
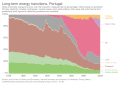 Long-term energy transitions, OWID.svg 850 × 600; 51 KB
-
 Means end.jpg 1063 × 593; 126 KB
-
 Netherlands electricity generation by source.png 1194 × 759; 87 KB
-

-
 Overlap between mining and biodiversity conservation.webp 980 × 581; 17 KB
-

-
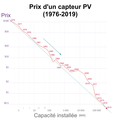 Prix d'un capteur photovoltaïque (1976-2019).png 2000 × 2100; 240 KB
-
 Share of global primary energy consumption by source, OWID.svg 850 × 600; 13 KB
-

-
 Solar-pv-prices-vs-cumulative-capacity.png 1998 × 2058; 290 KB
-
 Staying big or getting smaller.jpg 2067 × 2000; 341 KB
-
 Switzerland electricity generation by source.png 1194 × 759; 78 KB
-
 Szenarien.jpg 587 × 339; 137 KB
-
 The hidden helper of the energy transition, efficiency.jpg 2067 × 3050; 748 KB
-
 Time To ACT plc Logo.jpg 4961 × 1005; 347 KB
-
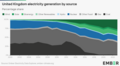 United Kingdom electricity generation by source.png 1194 × 759; 95 KB
-
 V4 Web BOeLL-FF Energiewende (page 16 crop) jobs.jpg 1699 × 1998; 169 KB
-
 V4 Web BOeLL-FF Energiewende (page 8 crop) - Stromausfall.jpg 1681 × 2017; 145 KB
-
 V4 Web BOeLL-FF Energiewende.pdf 872 × 1062, 23 strony; 486 KB
-
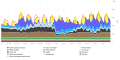 Variable renewable energy.svg 1000 × 500; 377 KB
-
 빅스포 사진 01.jpg 4000 × 2667; 1,35 MB


_annual_sales_-_BloombergNEF.svg)
_-_renewable_energy.svg)


,_OWID.svg)

,_OWID.svg)


.png)


_jobs.jpg)
_-_Stromausfall.jpg)

